
U.S. Fund Flows: October Outflows Provide a Scare Reminiscent of 2022
Funds shed almost $50 billion during the month.
/s3.amazonaws.com/arc-authors/morningstar/96a2625e-83c2-4fdb-9fd7-0efcd07c88bb.jpg)
/s3.amazonaws.com/arc-authors/morningstar/30e2fda6-bf21-4e54-9e50-831a2bcccd80.jpg)

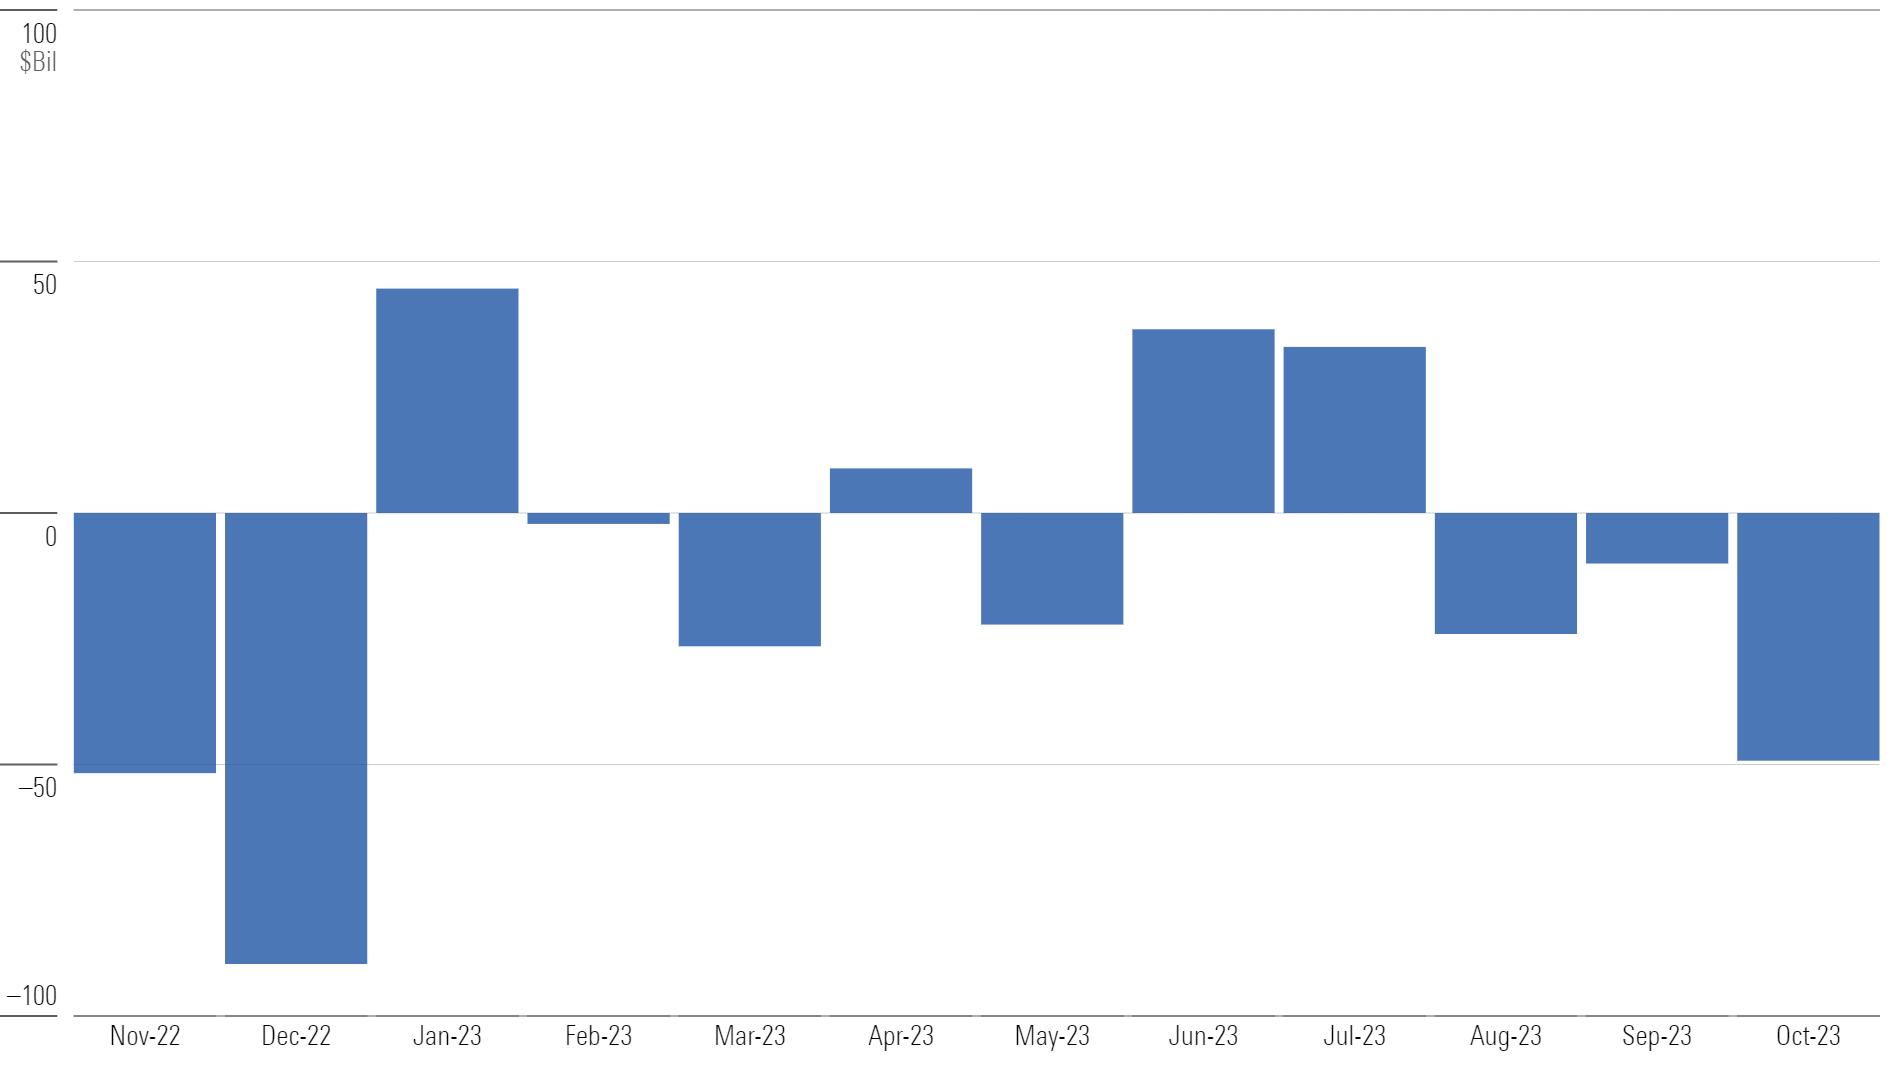
U.S. mutual funds and exchange-traded funds bled nearly $50 billion in October 2023—their worst month of outflows since December 2022. It marked the third consecutive month of outflows, and the sixth so far this year. Just two of the 10 category groups posted inflows during the month.
Monthly Long-Term U.S. Fund Flows
Flows Into Broad Index Trackers Mask Flight From Large-Value Funds
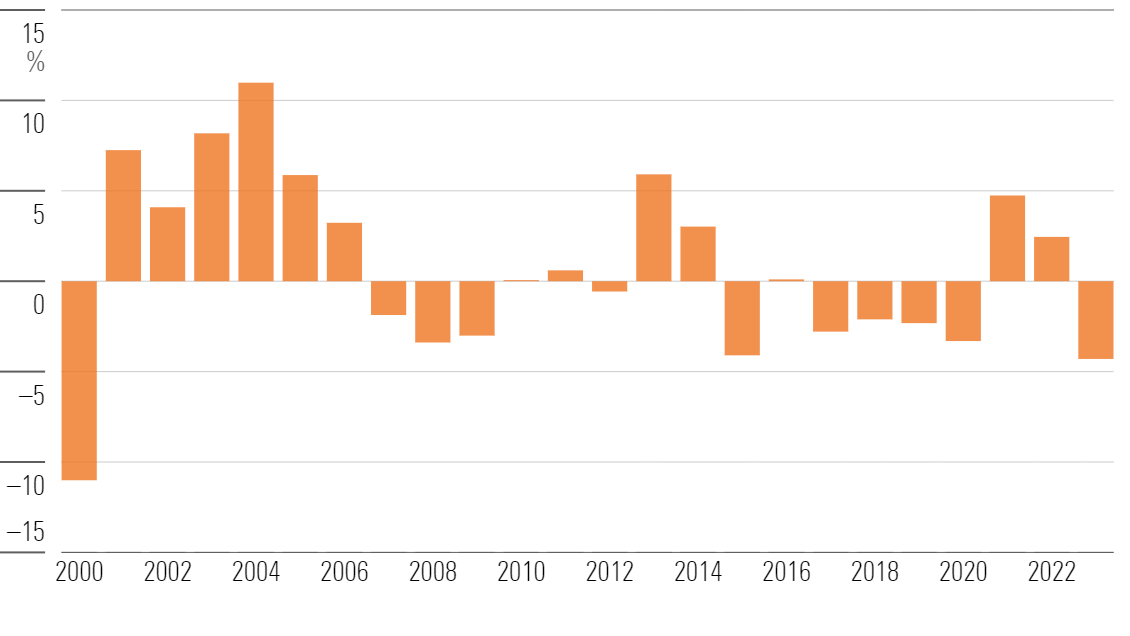
About $1.2 billion left U.S. equity funds in October, bringing their year-to-date outflow to $81 billion. Led by passive offerings, large-blend funds took in $17.7 billion, while large-value funds shed $10.9 billion. Large-value funds have suffered outflows in every month this year. Their negative 4.3% year-to-date organic growth rate is on pace for their worst calendar-year tally since 2000.
Large-Value Organic Growth Rates
Outflows From Riskier Segments Hurt Taxable-Bond Funds
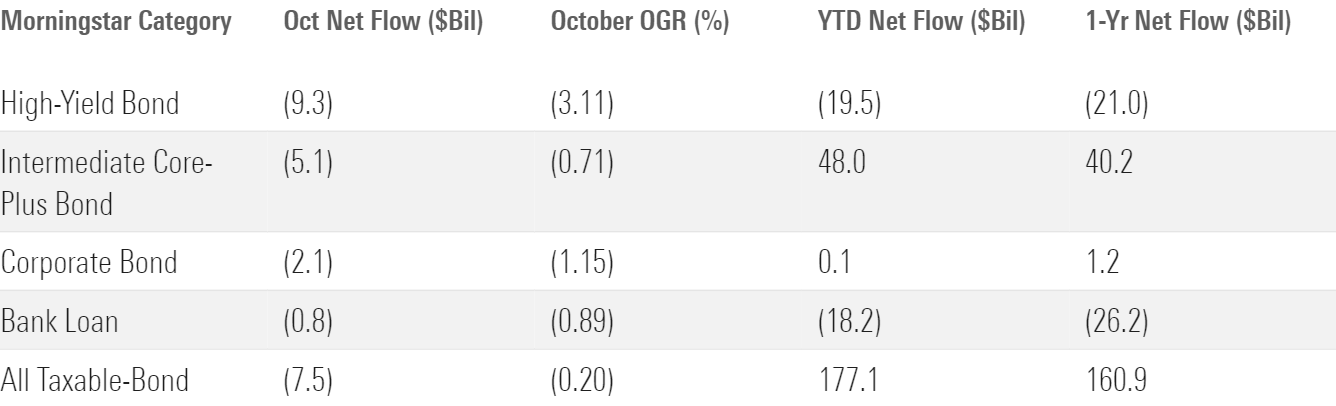
Taxable-bond funds shed $7.5 billion in October, their worst month since December 2022. Funds that court the most credit risk were hit the hardest. Intermediate core-plus bond funds endured outflows for the first time in 2023, and the woes continued for high-yield bond and bank-loan portfolios. Attractive yields available in safer corners of the bond market might have reduced investor appetite for credit risk.
Taxable-Bond Net Flows
Ultrashort Bond Funds Step Up
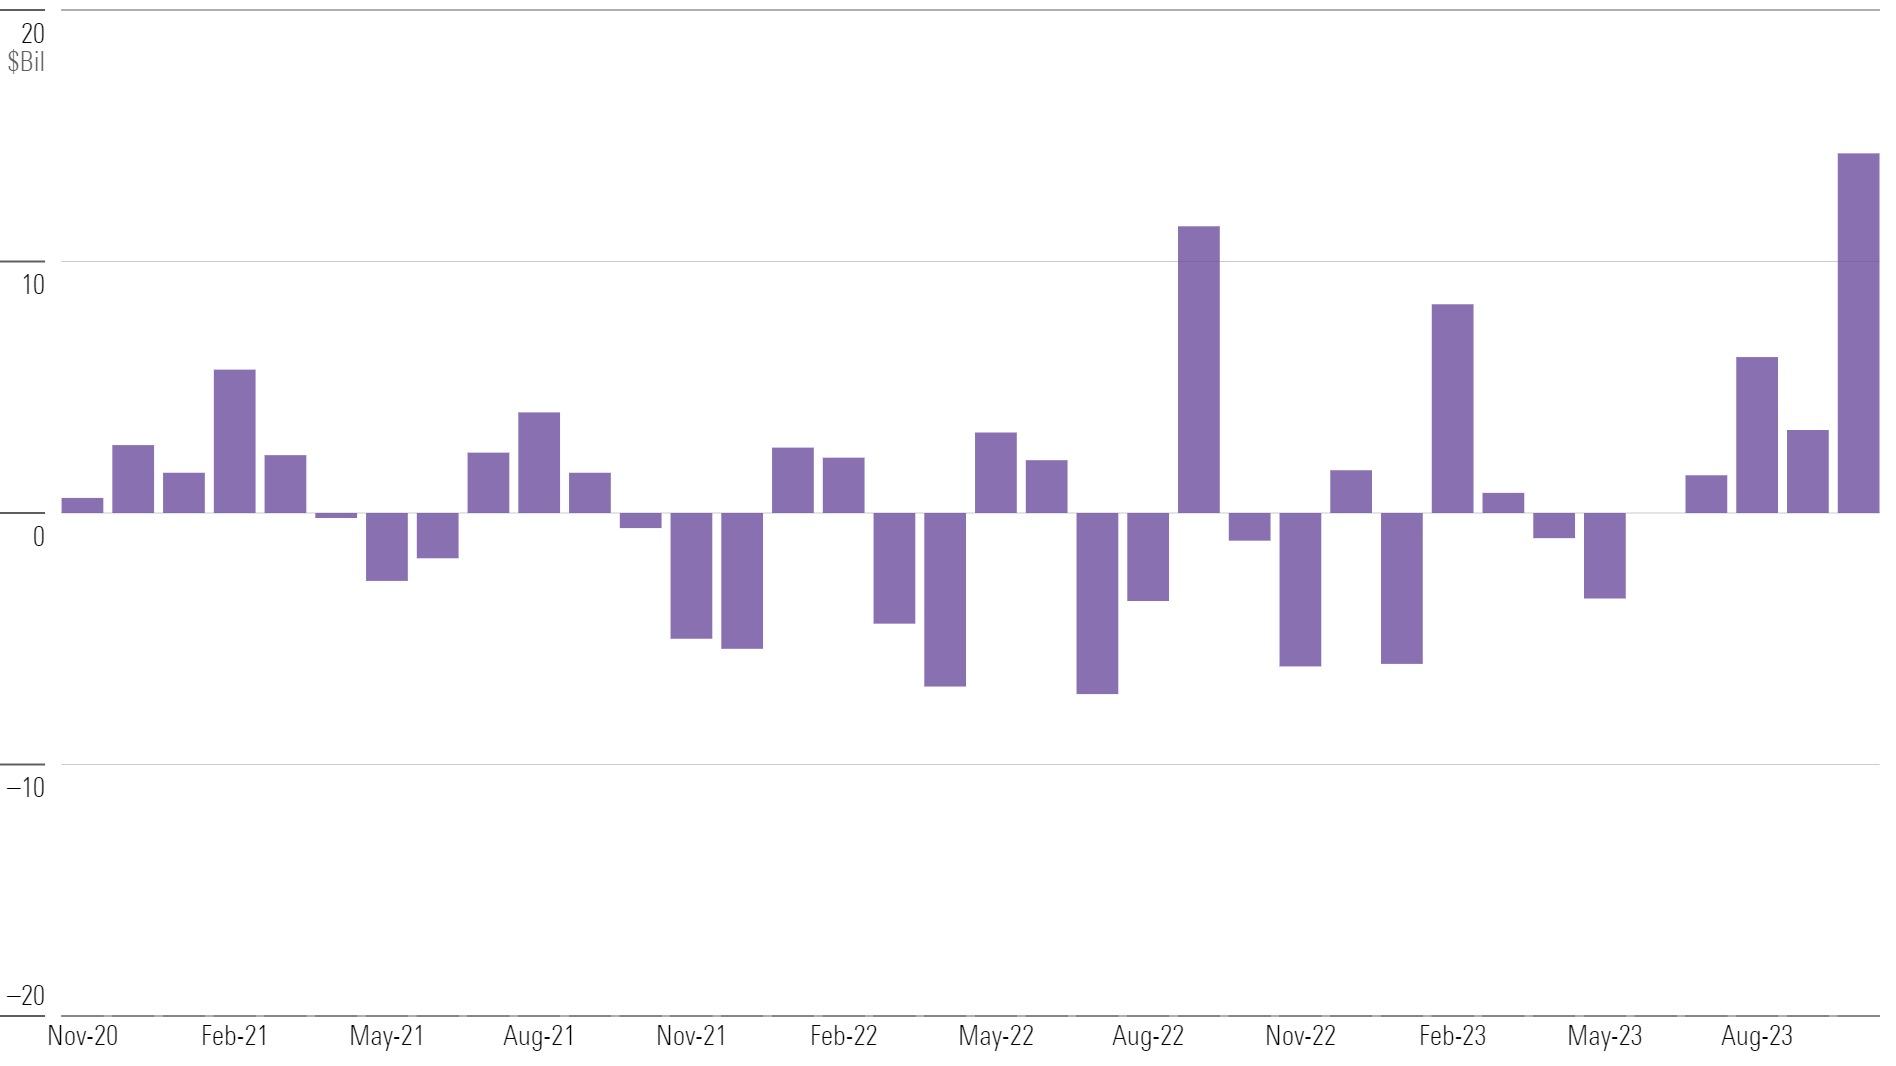
Ultrashort bond funds hauled in a record $14.3 billion in October, nearly matching their total net flows over the prior 36 months. With durations of less than one year, these uber-safe portfolios are effectively a substitute for cash. SPDR Bloomberg 1-3 Month T-Bill ETF BIL benefited most from their popularity, reeling in $7.6 billion in October—second-most among all funds.
Ultrashort Bond Net Flows
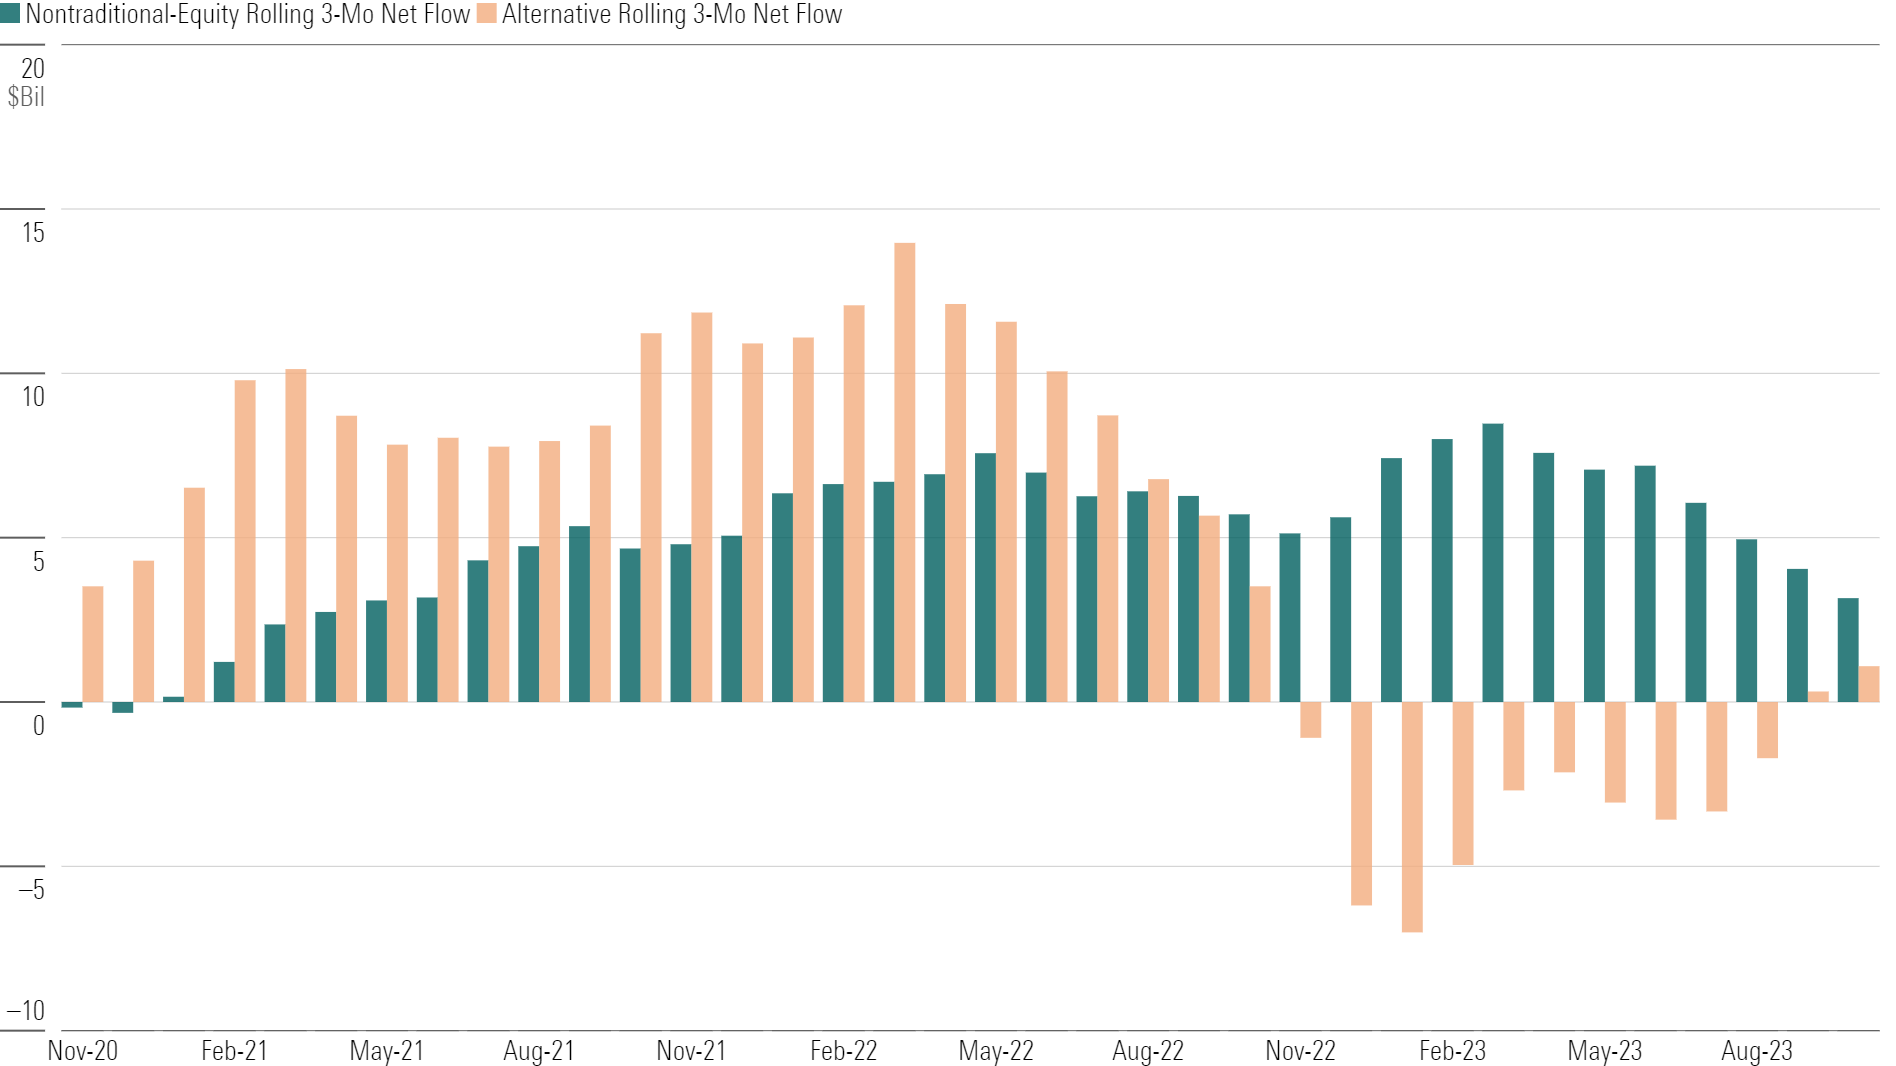
Tide Might Be Turning for Diversifiers
Alternative funds are back on investors’ radar, perhaps because of turbulent stock and bond returns. They have notched inflows in four consecutive months, collecting more each month than the last. Meanwhile, the momentum is slowing for nontraditional-equity funds. They collected $475 million in October, but that marked the first month they failed to crack $1 billion since April 2021.
Alternatives and Nontraditional Equity Net Flows
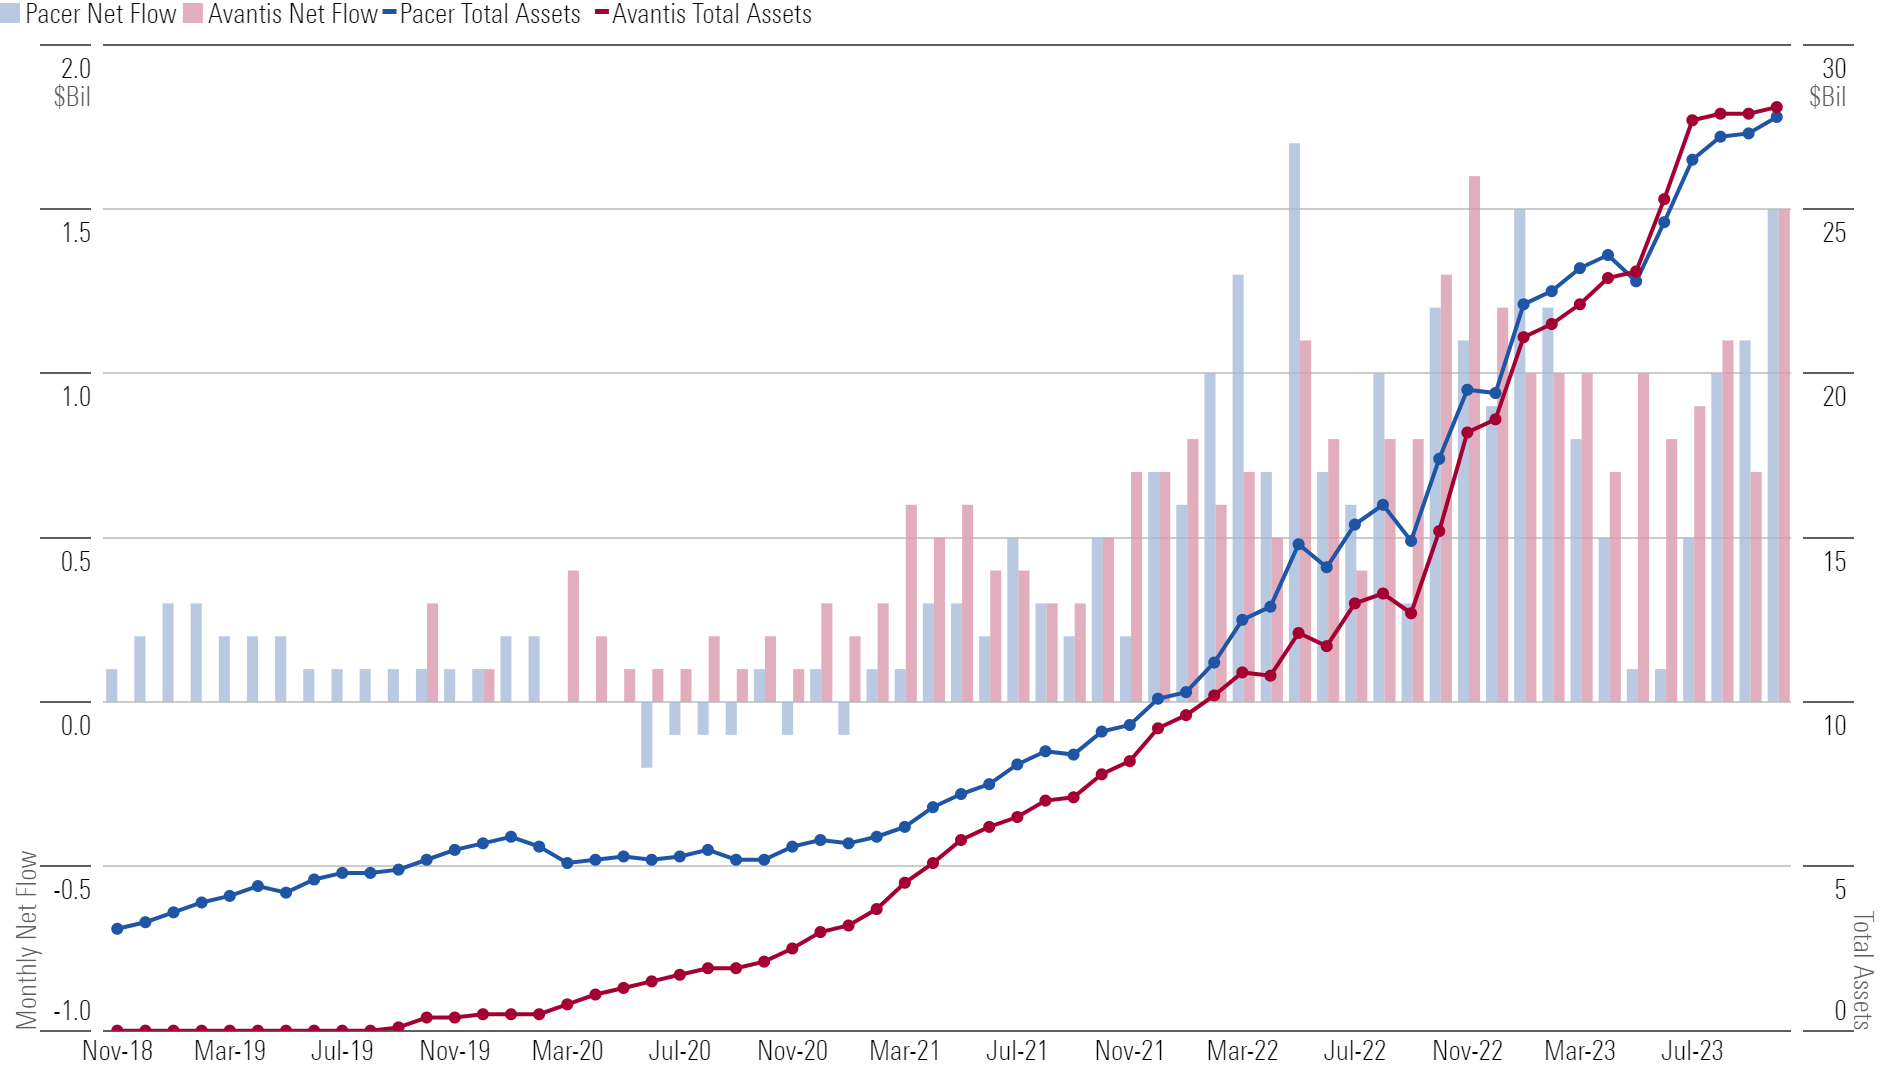
ETF Providers Ascend
Pacer and Avantis each managed about $28 billion in assets when the books closed on October. Both shops focus on ETFs: Pacer on fundamentally weighted index funds, Avantis on systematic active ones. While the two providers offer different ways of investing, surging demand for ETFs has powered excellent growth for both.
Pacer and Avantis Net Flows
This article is adapted from the Morningstar Direct U.S. Asset Flows Commentary for October 2023. Download the full report here.
The author or authors do not own shares in any securities mentioned in this article. Find out about Morningstar’s editorial policies.
/cloudfront-us-east-1.images.arcpublishing.com/morningstar/AGAGH4NDF5FCRKXQANXPYS6TBQ.png)
/cloudfront-us-east-1.images.arcpublishing.com/morningstar/PEXHY2NG2ZPQBNXNNFWY76ZU5U.jpg)
/cloudfront-us-east-1.images.arcpublishing.com/morningstar/QFQHXAHS7NCLFPIIBXZZZWXMXA.jpg)
:quality(80)/s3.amazonaws.com/arc-authors/morningstar/96a2625e-83c2-4fdb-9fd7-0efcd07c88bb.jpg)
:quality(80)/s3.amazonaws.com/arc-authors/morningstar/30e2fda6-bf21-4e54-9e50-831a2bcccd80.jpg)