
5 Takeaways on the 529 Savings Plan Landscape
Our annual look at 529 industry movements in assets, fees, and more.
/s3.amazonaws.com/arc-authors/morningstar/9e407e19-2c9a-4686-b59c-2dc342d81fdd.jpg)

Since their launch more than 20 years ago, 529 education savings plans have helped students and their families better access higher education through tax-advantaged investing. Moreover, 529 plans have become relevant to an increasing number of investors as their use cases have expanded over the years (the most recent evolution including Roth IRA rollovers).
In this annual industry review, we track key metrics across the 529 college savings plan landscape, including assets, fees, and more. Here are five takeaways:
- The total plan assets increased 16%, to $441 billion from $385 billion.
- Average beneficiary has grown older; in June 2023, it reached 14.5.
- Glide paths became smoother; 81% of all glide paths had less than 10% equity step-downs.
- Average progressive and single-option age-based glide paths lowered their equity allocation near enrollment year.
- Fees have stayed steady on average; direct-sold plans maintain their fee advantage over advisor-sold plans.
529 Industry Assets Recover From the 2022 Dip
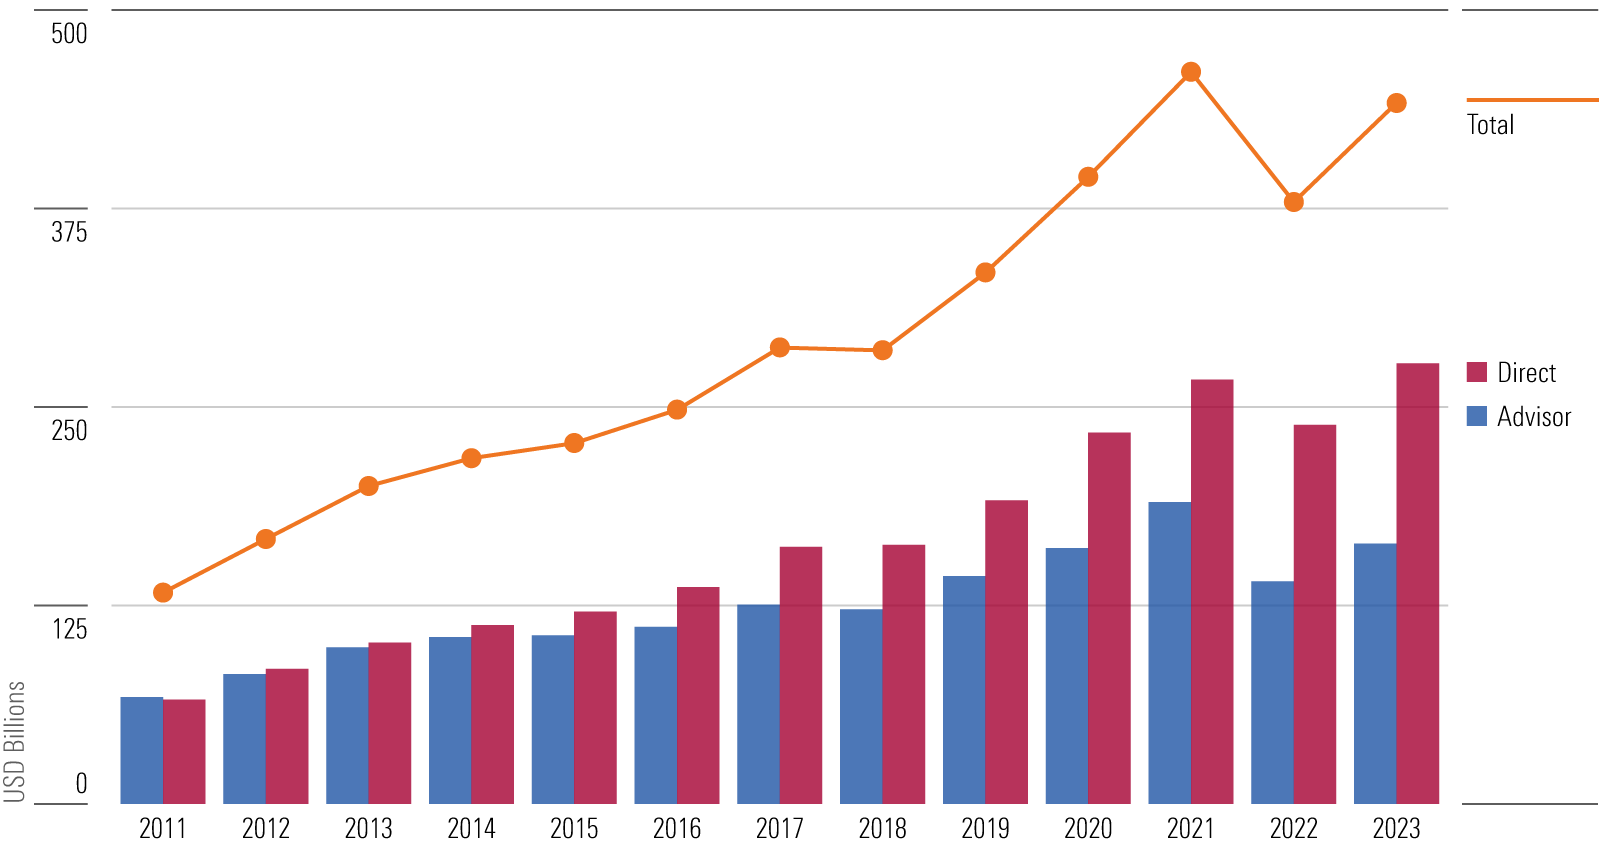
In 2023, the 529 industry saw a recovery in total plan assets, following a sizable decline in 2022. All but four plans recorded a positive change in net assets, with an average plan experiencing a 12% increase in net assets. The $441 billion in industry assets as of 2023 year-end was 16% higher than 2022′s $385 billion, though the figure was still lower than 2021′s $461 billion.
Assets in advisor-sold plans saw a slightly higher growth—17%—than those in direct-sold plans, which grew 16% in total. While an average direct-sold plan’s 13% net asset growth was higher than an average advisor-sold plan’s 10% growth, a few advisor-sold plans grew enough to tip the scale at the distribution level. For instance, Virginia’s CollegeAmerica saw its net assets increase by more than $11 billion in 2023.
Assets in 529 Plans, by Distribution Channel
Average Beneficiary Age of 529 Plans Increases
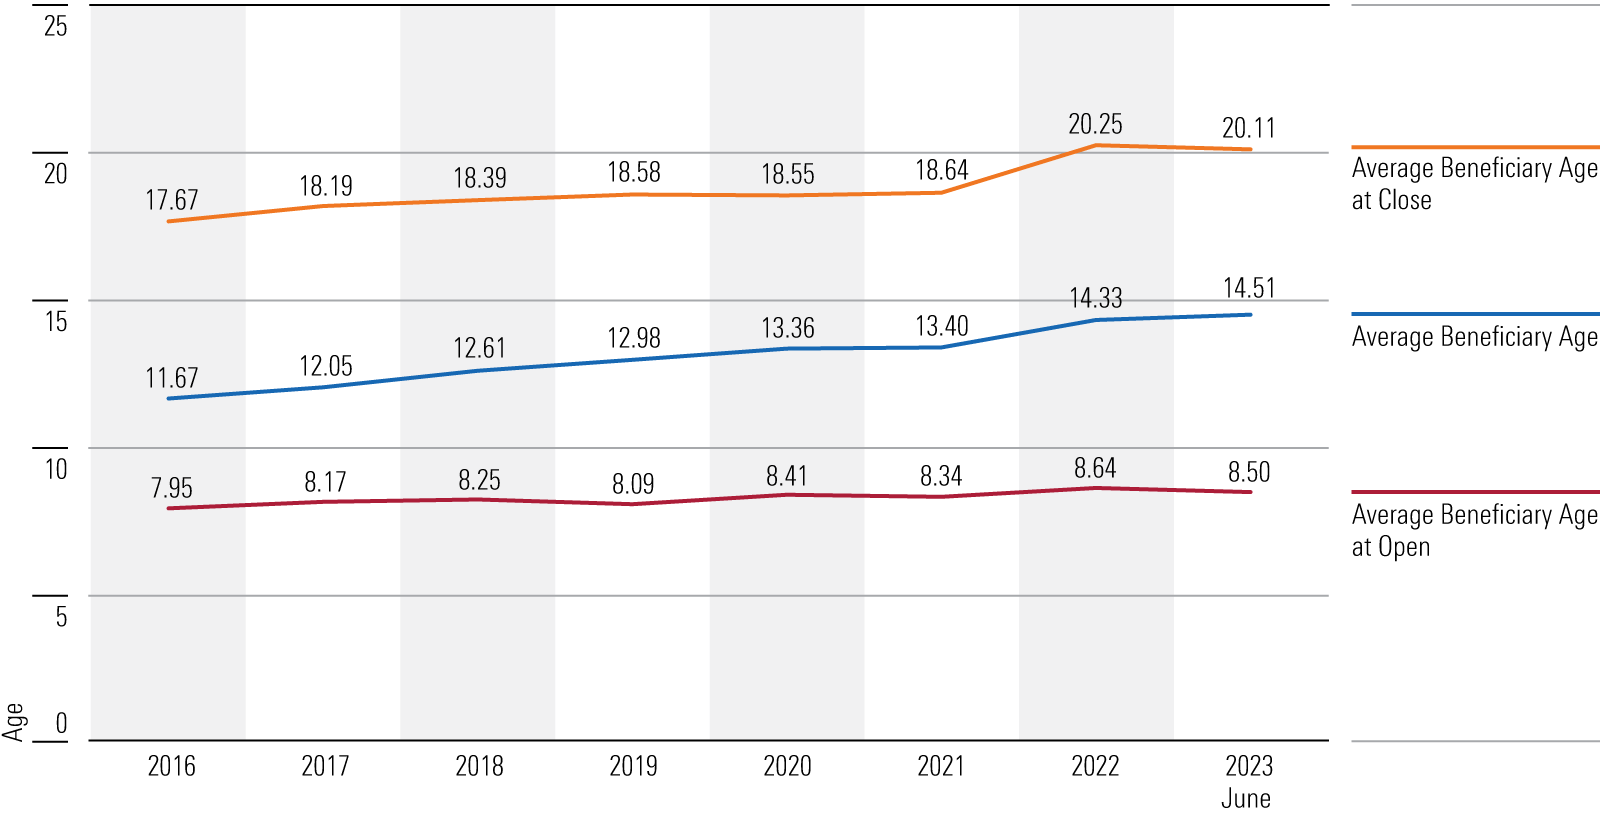
Surveys sent out to 529 plans under Morningstar coverage (representing 94% of industry assets as of 2023) show that average beneficiary age has steadily inched higher, to 15 in 2023 from 12 in 2016. Average beneficiary age at account opening has remained relatively steady, but accounts are open for longer. In 2022, we saw a jump in average beneficiary age at account closing, and in 2023, it stayed relatively high, at above 20. While we do not know the exact cause, part of this increase can be attributed to a pandemic-induced delay in higher education, as well as the expanding use of funds for student loan payment, postbaccalaureate education, and retirement.
Average Beneficiary Age for 529 Plans
529 Glide Paths Continue to Become Smoother
Many 529 accountholders are hands-off investors who use age-based or target-enrollment portfolios. These portfolios start with a large allocation in risky assets (generally stocks) when the beneficiary is young. As the beneficiary grows older, the portfolios become more conservative by allocating more to bonds and cash or cashlike accounts. A glide path determines how the allocation shifts to a more conservative positioning as the beneficiary grows closer to college enrollment.
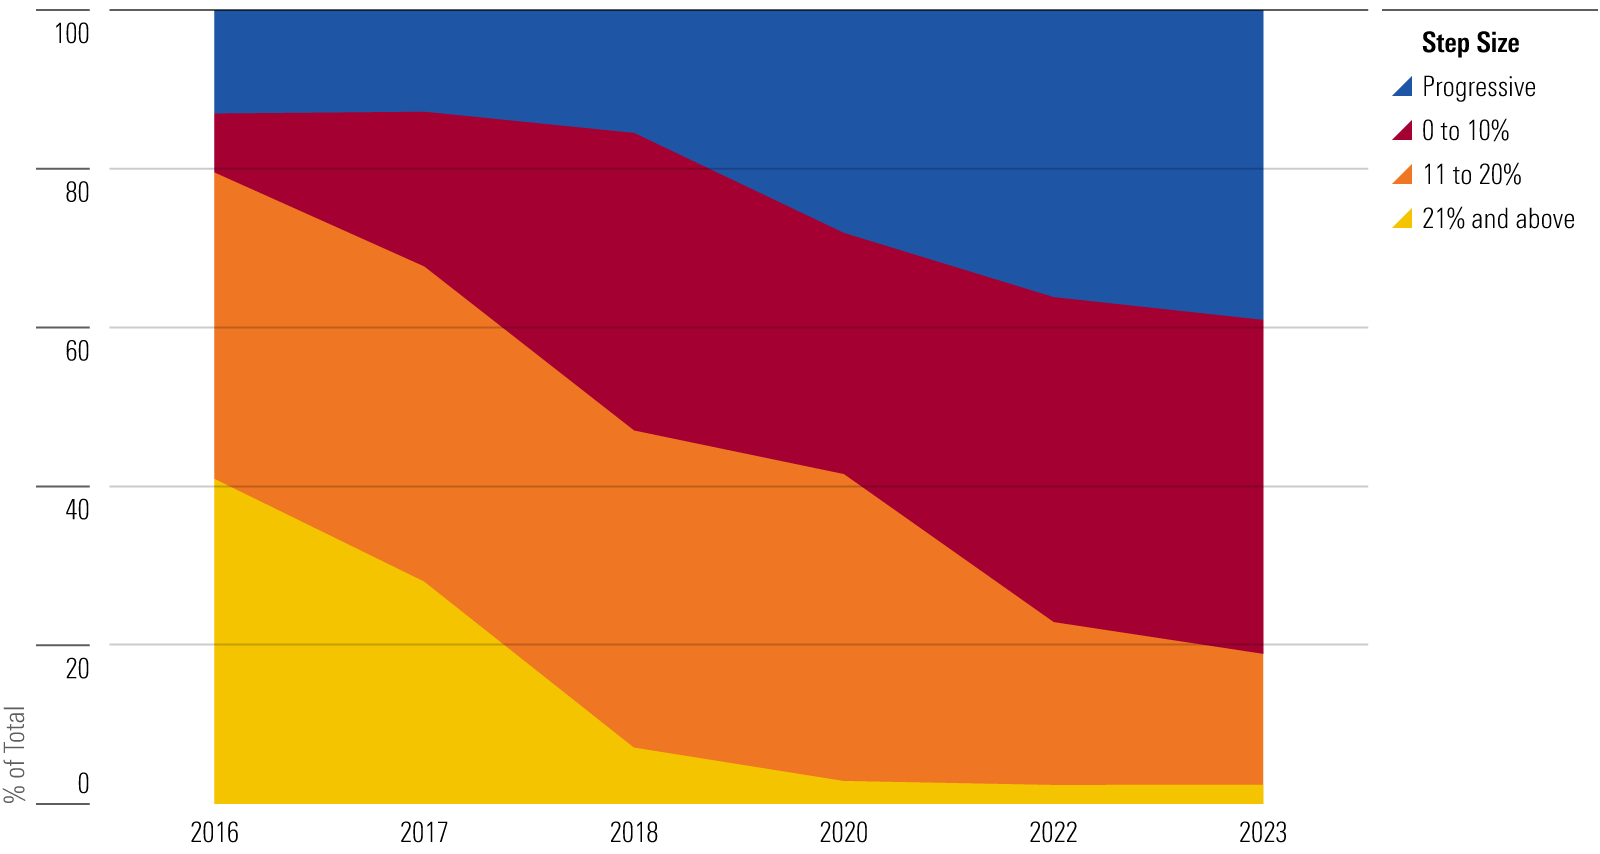
Over the years, Morningstar has cautioned investors against glide paths with large equity steps (21% or more), as they expose investors to market-timing risk. If a portfolio happens to derisk after a large market decline, investors risk locking in their losses and capping their upside by selling stocks at their low and allocating those funds to bonds and cash.
As such, glide paths have become smoother in recent years. Several plans have adopted a progressive glide path, which makes small, frequent allocation changes. As of 2023 year-end, close to 40% of all plans featured a progressive glide path, yet another increase from 2022′s 36% and a substantial increase since 2018, when just 16% of plans offered a progressive glide path.
Others have added portfolios to their age-based series so that the equity step-downs (which take place in one day) are 12.5% or less. As of year-end 2023, 81% of all plans featured equity steps of 10% or less, and series with large step-downs (21% and above) accounted for less than 3% of the industry.
Percentage of Series by Greatest Equity Step
Decreasing Equity Risk Near Enrollment
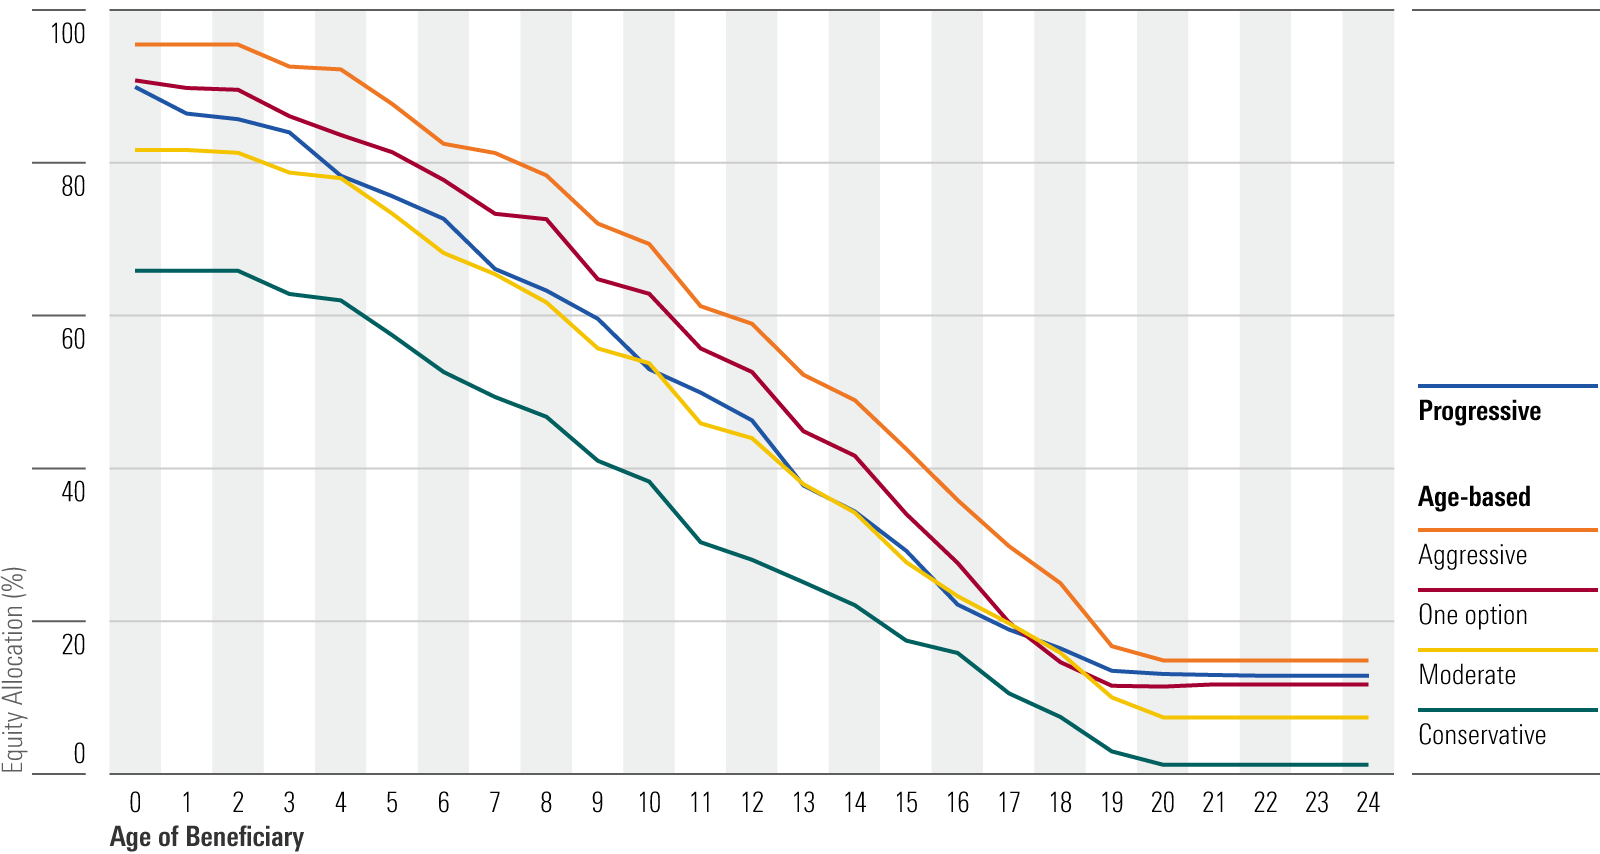
In 2023, plans that offer a single progressive glide path decreased their average equity allocation near enrollment. As rates have considerably increased for shorter-term bonds, plans can take less equity risk near the enrollment year to focus more on capital preservation while reaping higher yields from fixed-income holdings, such as money market or stable-value funds.
The average starting allocation to equity for this group of 62 series remains around 90%. However, the equity allocation closer to target enrollment year decreased substantially, to 16% in 2023 from 20% in 2022. The final landing point also decreased to 13% in 2023 from 17% in 2022. Of the remaining four groups that follow an age-based stepped glide path, there are 24 plans that offer one glide path option, depicted as “Age-Based: One Option.” These plans also saw a 2% decrease in average equity allocation around enrollment age (age 17-18).
Average Glide Paths for Progressive and Age-Based Series
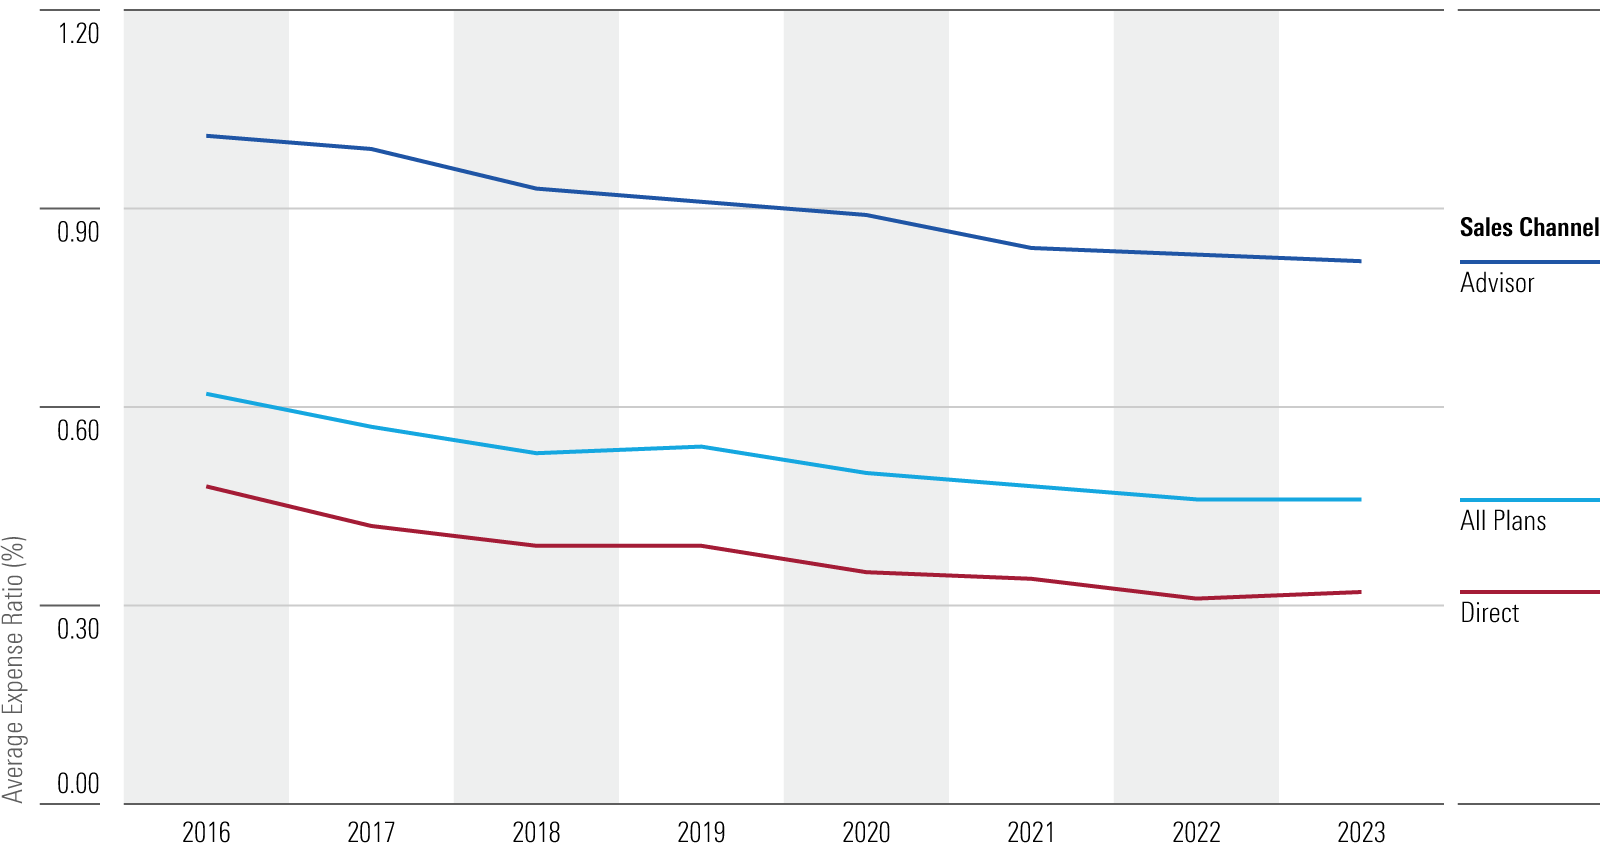
Fees Stay Low; Direct-Sold 529 Plans Maintain Their Fee Advantage
After several years of fee slashing, the average fee for an age-based or target-enrollment series stayed steady at 0.46%. These series still have a distinct fee advantage when accessed through direct-sold plans, whose 0.32% average expense ratio is 50 basis points cheaper than advisor-sold plans’ average of 0.82%. Both direct-sold and advisor-sold plans had their average fees stay steady in 2023. The industry saw many plans switch to cheaper (often passive) underlying funds in recent years, which left fewer plans to make the same move in 2023. Still, plans with a growing and relatively larger asset base can achieve economies of scale through reduction in asset-based fees or administrative fees.
Average Expense Ratios of Age-Based and Target Enrollment Series
The author or authors do not own shares in any securities mentioned in this article. Find out about Morningstar’s editorial policies.
/cloudfront-us-east-1.images.arcpublishing.com/morningstar/UWZH3VLHBVCIDP2ANJ73YKE4QA.png)
/cloudfront-us-east-1.images.arcpublishing.com/morningstar/ZLDA7BGZZFCDHCDRMM4AZLHG4A.jpg)
/cloudfront-us-east-1.images.arcpublishing.com/morningstar/5IA2JBRCCRGQREFFTDUALNOCM4.jpg)
:quality(80)/s3.amazonaws.com/arc-authors/morningstar/9e407e19-2c9a-4686-b59c-2dc342d81fdd.jpg)