
13 Charts On the Changing Market Mood In Q3
Both stocks and bonds fell as ‘higher for longer’ became the mantra for interest rates.
/s3.amazonaws.com/arc-authors/morningstar/ba63f047-a5cf-49a2-aa38-61ba5ba0cc9e.jpg)

During the third quarter, the young bull market for stocks got stuck in the mud.
As the Federal Reserve talked of keeping rates “higher for longer,” bond yields jumped, bogging down the 2023 first-half rally for stocks.
In the background, good news around a strong U.S. economy has turned from a tailwind into a headwind as it spurred a swing in expectations around the outlook for Fed policy. Despite strong second-quarter earnings and normalizing inflation, U.S. stocks moved sideways within a +/- 6% range. The IPO renaissance, which looked promising in early September, petered out.
Looking ahead, the near-term outlook for investor portfolios appears to ride on how long interest rates stay high, as well as whether the economy can make a soft landing and avoid a recession.
Under the hood of the stock market, the third quarter reflected a change in sentiment, as tech stocks floundered while energy stocks had a big rally. Real estate stocks crumbled on fears of a slowdown in the housing market.
In the bond market, yields rose to their highest levels since 2007, and U.S. Treasury bonds suffered. Corporate bonds stayed afloat, and riskier high-yield areas of the bond market performed best. But overall, unless there is a sudden shift in the outlook, the overall bond market is on track for its third straight year of losses, with the Morningstar US Core Bond Index down 1.2% so far in 2023.
U.S. Stock Market Performance
Key Stats: Q3 2023 Market Performance
- Stocks fell 3.2%, the smallest quarterly move in two years.
- The Morningstar US Market Index finished the quarter up 12.8% for the year to date.
- Energy stocks led, rising 12.7% for their best performance since the fourth quarter of 2022 (up 21%).
- Big tech stocks lost steam, with Apple AAPL, Microsoft MSFT, and Nvidia NVDA all down.
- The Morningstar US Real Estate Index posted its worst quarter in a year amid rising interest rates.
- Dividend stocks, such as those in the Morningstar US Dividend Composite Index, outperformed for the first time since late 2022.
- Long-term treasury bonds slid. The Morningstar US 10+ Year Treasury Bond Index suffered its worst loss since the first quarter of 2021.
- The Morningstar LSTA US Leveraged Loan Index outperformed key Morningstar bond indexes, gaining 3.5%.
- Oil prices topped $90 per barrel for the first time since November 2022.
- The yield curve stayed inverted for the sixth straight quarter, though the inversion narrowed.
Quarterly Market Performance Barometer
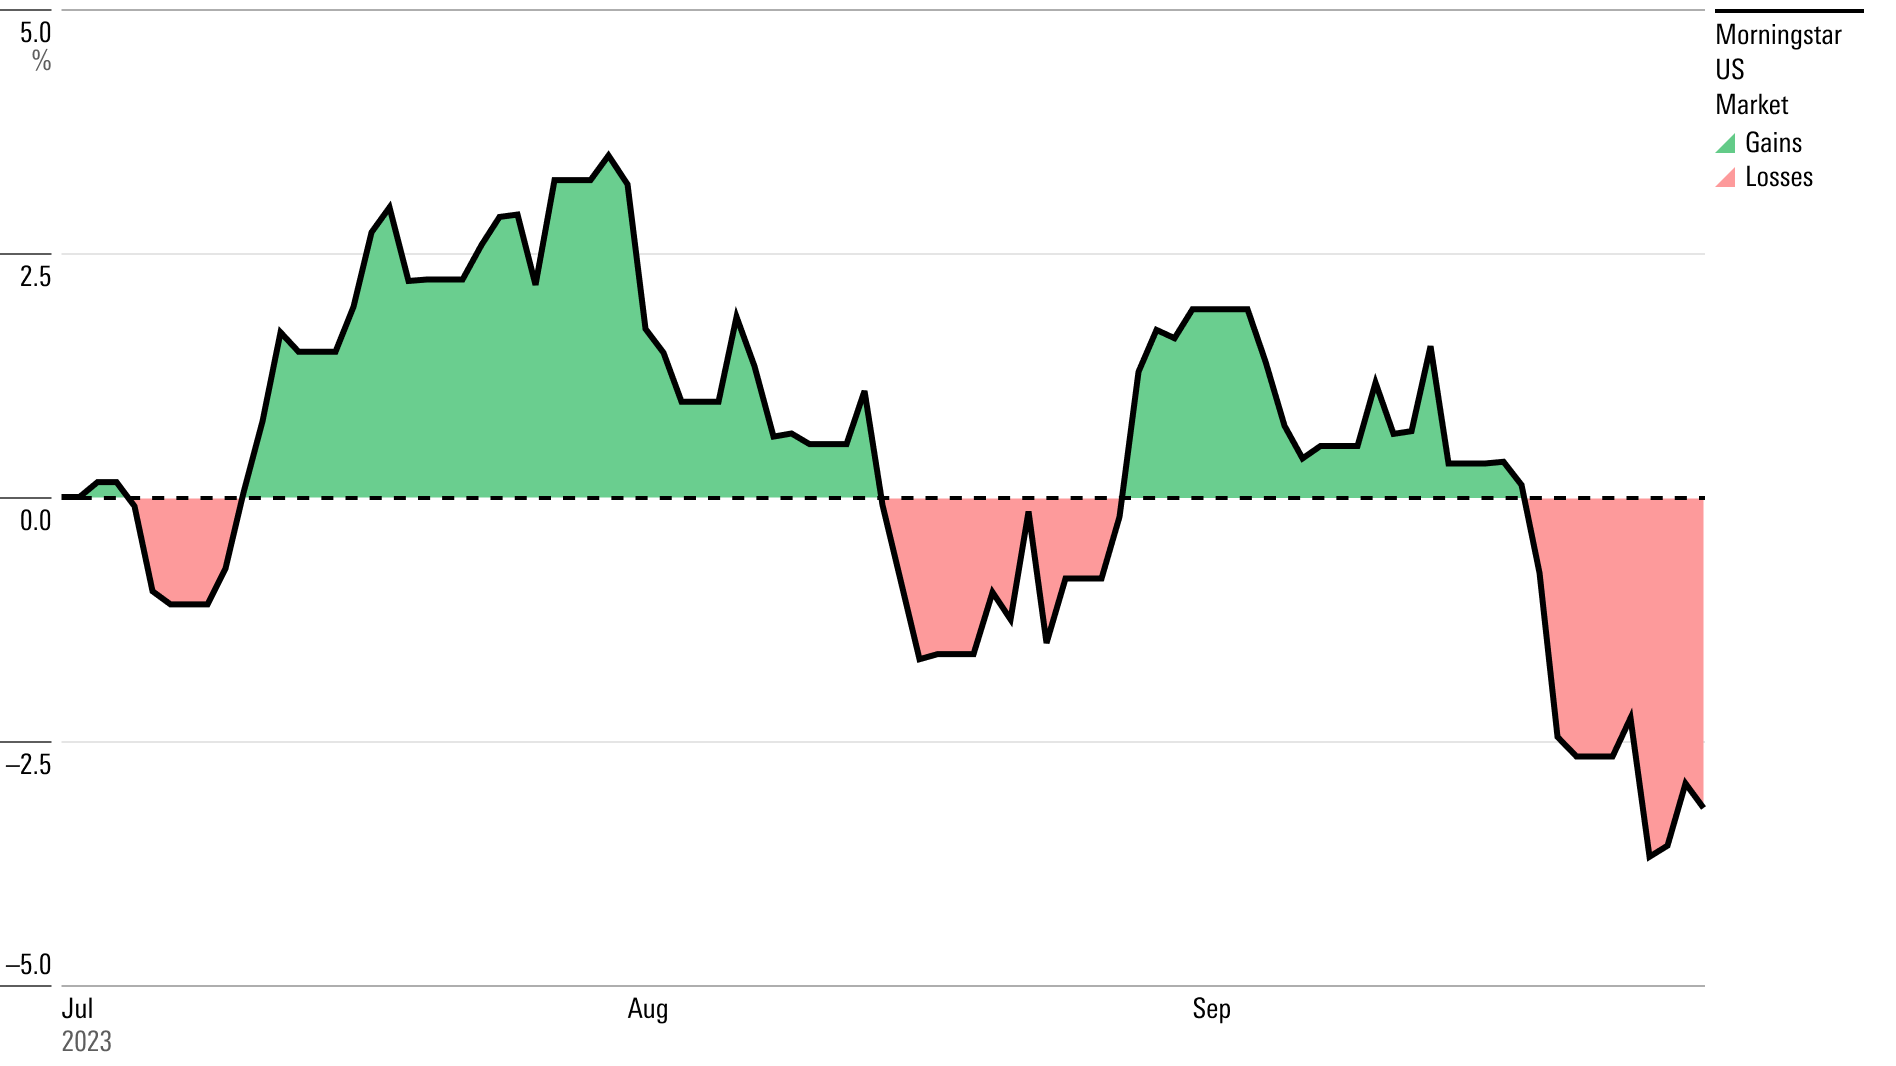
Stock Market Performance
During the third quarter, the U.S. stock market hovered within a relatively tight range, rising 3.5% at its peak and ending the quarter down 3.2% from where it started.
For the calendar year, stocks are up 12.8%. The Morningstar US Market Index ended the quarter up 21.1% from its bear market low on Oct. 14, 2022, holding in bull territory. However, the index is still 9.1% below its high in January 2022.
Stocks came into the quarter continuing their first-half rally. The market hit what has turned out to be 2023′s high point so far on July 31, when the Morningstar US Market Index was up 20.6% from the start of the year.
For much of the rally, the very largest tech stocks—including Apple, Microsoft, Alphabet GOOGL, Amazon.com AMZN, and Nvidia—were driving the vast majority of the market’s returns. Through May, those five stocks alone contributed to 78% of the entire U.S. market’s gain, a hyper-concentration well above the long-term average contribution of 5% for the largest stocks.
In August and September, the story flipped as the market lost steam. The U.S. market index ended the quarter down 3.2%, 7.9 percentage points below its third-quarter high on July 31.
The same stocks that kicked off what many called a new bull market were the ones that subsequently took the market lower. Apple, Microsoft, and Nvidia were the leading detractors from Aug. 1 through the end of the quarter, followed by Tesla TSLA and Meta Platforms META.
At the same time, energy stocks shined thanks to rising oil prices, with the sector’s gains limiting the broader market’s declines.
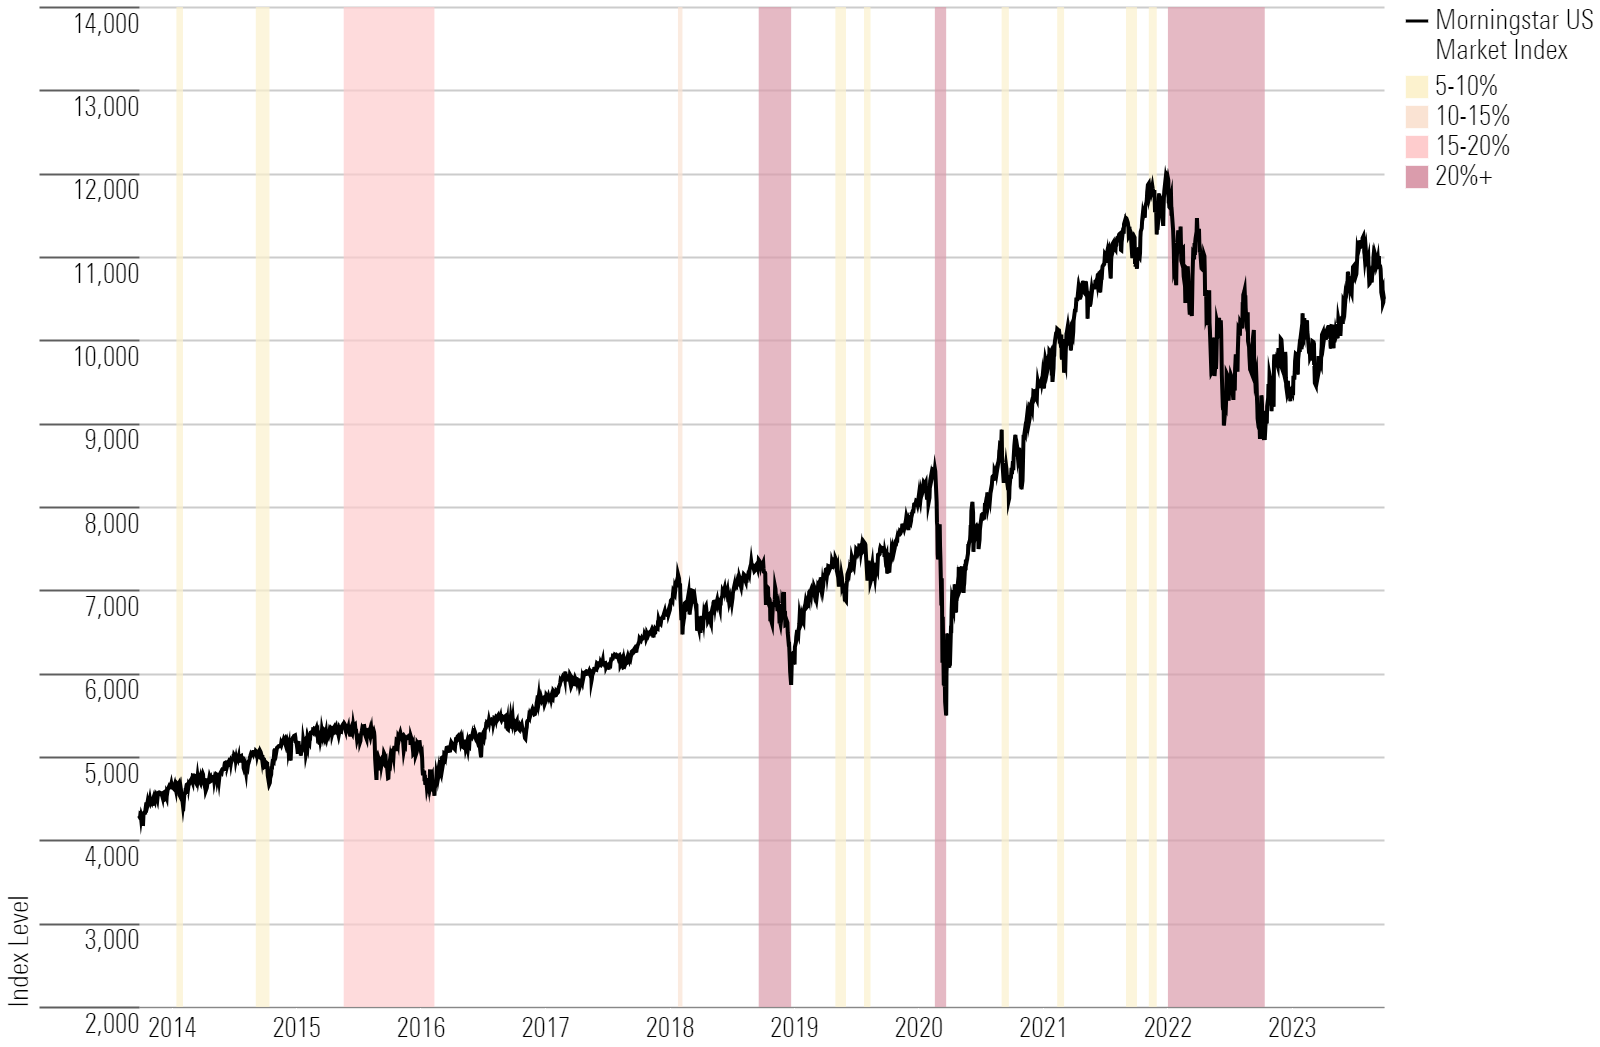
Stock Market Pullbacks
Value Stock vs. Growth Stock Performance
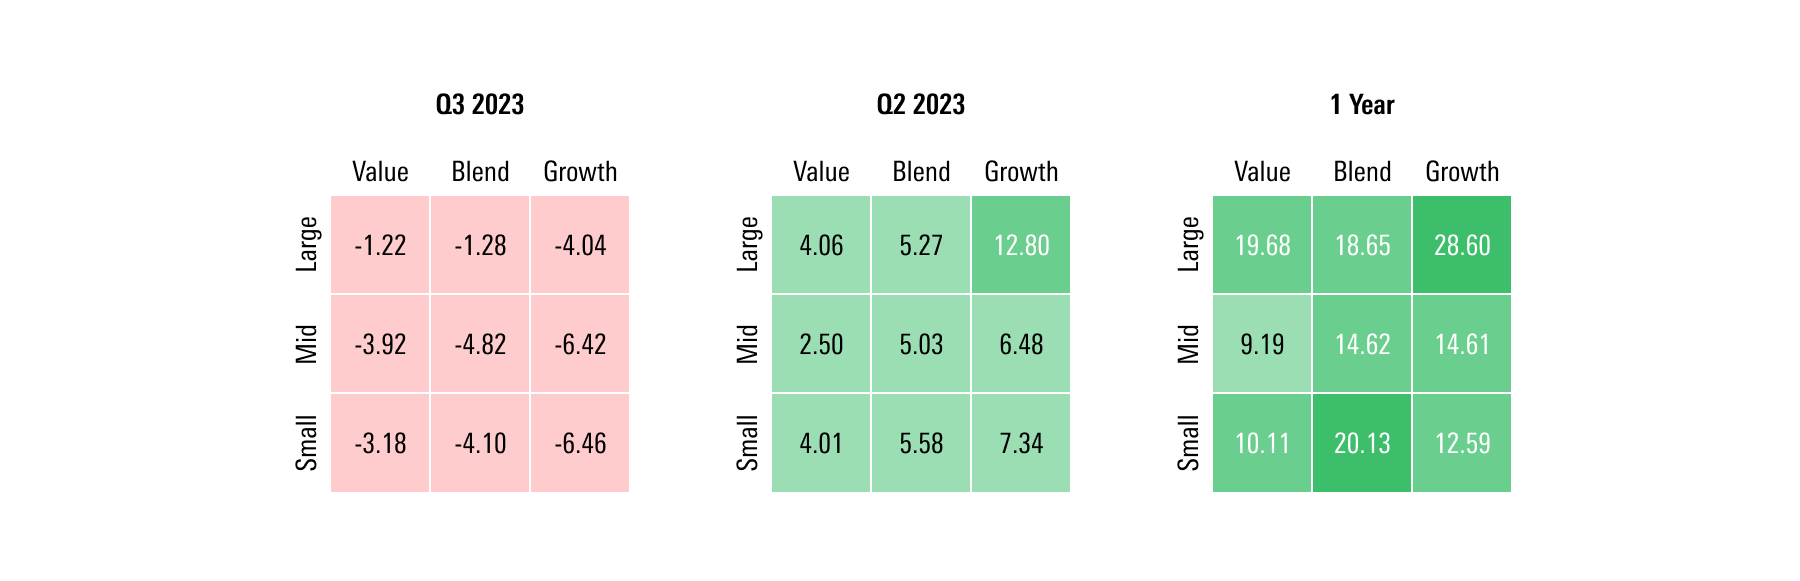
With rising bond yields taking the wind out of the sails of the growth stock rally, value stocks outperformed them during the third quarter. The Morningstar US Value Index ended the quarter down 1.9%, while the Morningstar US Growth Index fell 5.9%.
Small-growth stocks took the hardest hit, dragged down by double-digit declines in healthcare stocks, including sleep apnea technology provider Inspire Medical Systems INSP and biopharmaceutical developer TG Therapeutics TGTX. Smaller stocks fell twice as far as the largest stocks overall during the quarter. The Morningstar US Small Cap Index dropped 4.6%, and the Morningstar US Large Cap Index fell 2.5%.
Large-value stocks led the third quarter’s style box, driven by gains from heavy hitters like oil and gas giant Exxon Mobil XOM and Warren Buffett’s conglomerate holding company Berkshire Hathaway BRK.B.
However, over the past year, growth stocks have still been ahead of value stocks. The largest, growthiest stocks have been the biggest gainers, as mega-cap tech giants Microsoft, Apple, and Nvidia kicked off the new bull market in the first half of 2023.
U.S. Equity Style Box Performance
Stock Sector Performance
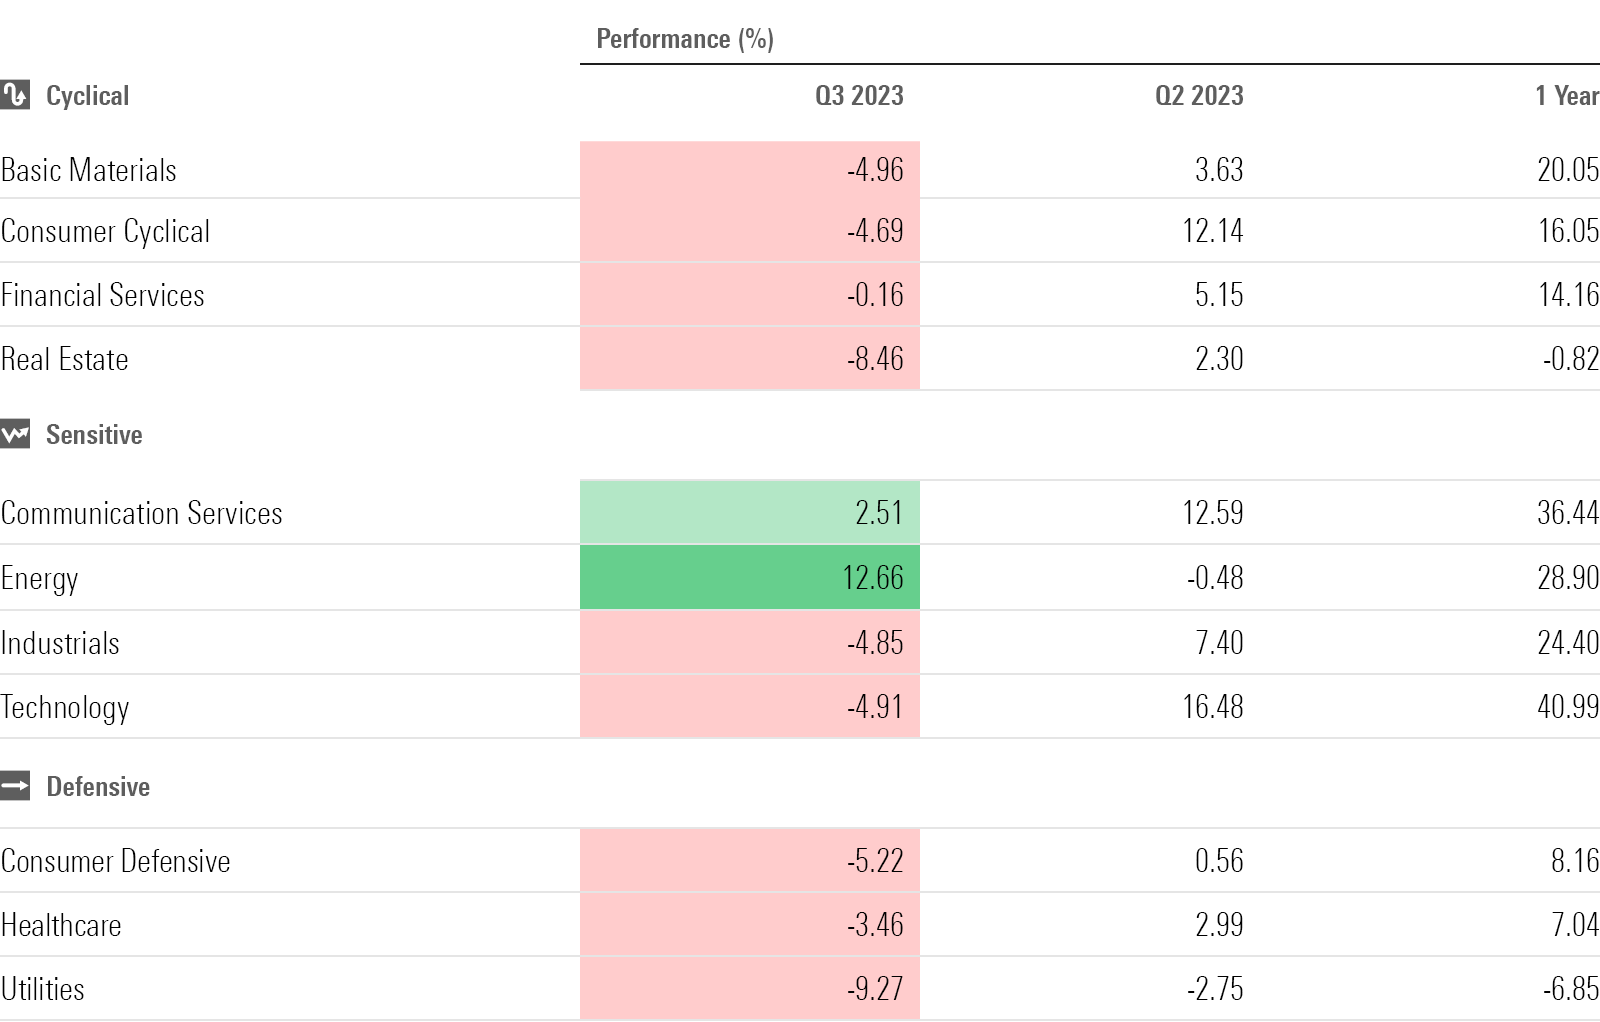
While the overall market ended the third quarter not far from where it started, there was a wide disparity between equity sectors.
Broadly, value-heavy sectors (like energy and financial services) helped keep the broader market afloat, while growth sectors (like technology and consumer cyclical) took losses. The exception on the growth side were communication services companies—including household names such as Alphabet and Meta—which ended the quarter with small gains.
Energy stocks were the quarter’s biggest winners, as well as the only sector to rise more than 10%. The Morningstar US Energy Index ended the quarter with a gain of 12.7% as supply constraints drove up the price of oil.
Morningstar equity analysts now see the energy sector as fairly valued. “With the recent sharp increase in oil prices, investors have become more enthusiastic about energy stock prices. Bargains are now much harder to find,” write Stephen Ellis and Adam Baker, Morningstar equity researchers for oil and gas. A few months ago, 36% of Morningstar’s energy coverage was undervalued; by the end of the third quarter, that number was sliced in half.
On the flip side, the technology sector suffered in the third quarter after flying high at the start of the year. The Morningstar US Technology Index fell 4.9%, dragged down by giants Apple (which fell 11.6%) and Microsoft (down 7.1%). Semiconductor stocks Advanced Micro Devices AMD and Broadcom AVGO were also a drag on the sector’s performance.
Real estate was the worst-performing sector behind utilities, with the Morningstar US Real Estate Index down 8.5% for the third quarter in response to the Fed’s higher-for-longer stance and continued concerns about tighter credit.
Morningstar Sector Indexes
Dividend Stock Performance
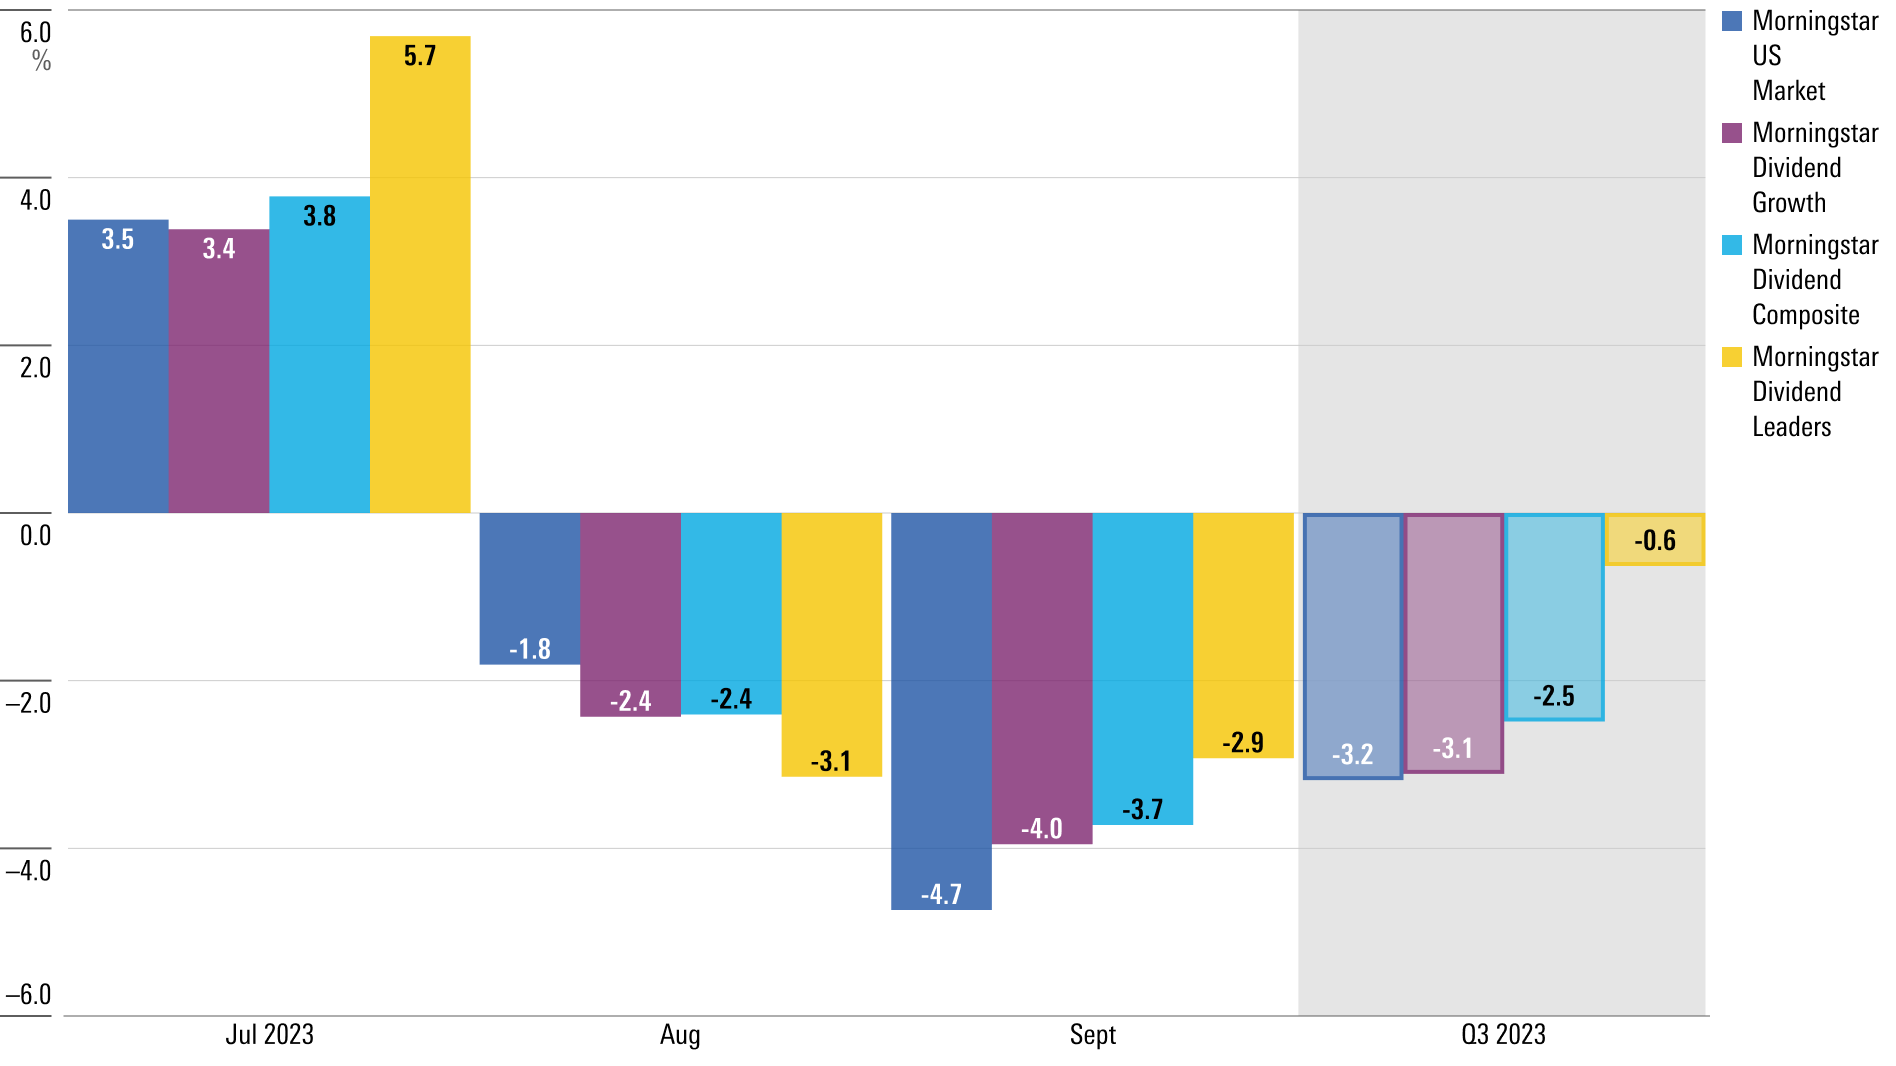
After underperforming during the first half of the year, dividend strategies held up better than the broader market in the third quarter. The highest-quality dividend payers ended the quarter in the positive, and other dividend strategies sustained losses that were smaller than what was seen in the rest of the market.
The Morningstar Dividend Leaders Index came in flat in the third quarter, while the US Market Index fell roughly 3%. The category was led by biopharmaceutical company AbbVie ABBV, which rose nearly 12% over the quarter, as well as energy companies like Chevron CVX and Phillips 66 PSX. Both companies come with a forward dividend yield of roughly 3.5%—more than twice the broader market’s average yield of 1.5%.
The Morningstar Dividend Composite Index, a broad measure of dividend stock performance, fell 2.5% during the third quarter, ending the period nearly 1 percentage point ahead of the overall stock market. Since January, though, the group is roughly 10 percentage points behind the broader market’s gain of 12.8%.
The Morningstar Dividend Growth Index, which represents the stocks of companies that have been growing their dividends over time, was also more buoyant than the broader stock market, ending the third quarter up 1.2%. Multinational biopharmaceutical company Amgen AMGN and Exxon Mobil were major contributors to the group’s gains.
Morningstar Dividend Indexes vs. U.S. Market
Fed Rate Hikes
Even as decades-high inflation showed meaningful signs of slowing, the Fed disappointed expectations of a quick pivot to cutting rates. Instead, the central bank indicated its resolve to keep interest rates higher for longer.
The Fed raised its benchmark federal-funds effective rate an additional 0.25 percentage points in July to a target range of 5.25%-5.50%, then held rates steady for two consecutive meetings. Since January, the Fed has raised rates four times so far—a slowing of its unprecedented pace seen in 2022, during which it raised rates from nothing to a target range of 4.25%-4.50%.
While the Fed’s projections and chair Jerome Powell’s September remarks tilted in a hawkish direction, Morningstar’s chief economist Preston Caldwell expects the central bank to cut interest rates aggressively over the next two years. His forecast is for inflation to reduce at a faster pace and GDP growth to fall, leading the Fed to cut rates aggressively in 2024 and 2025.
Treasury Yield and Federal-Funds Rate
Q3 2023 Bond Market Performance
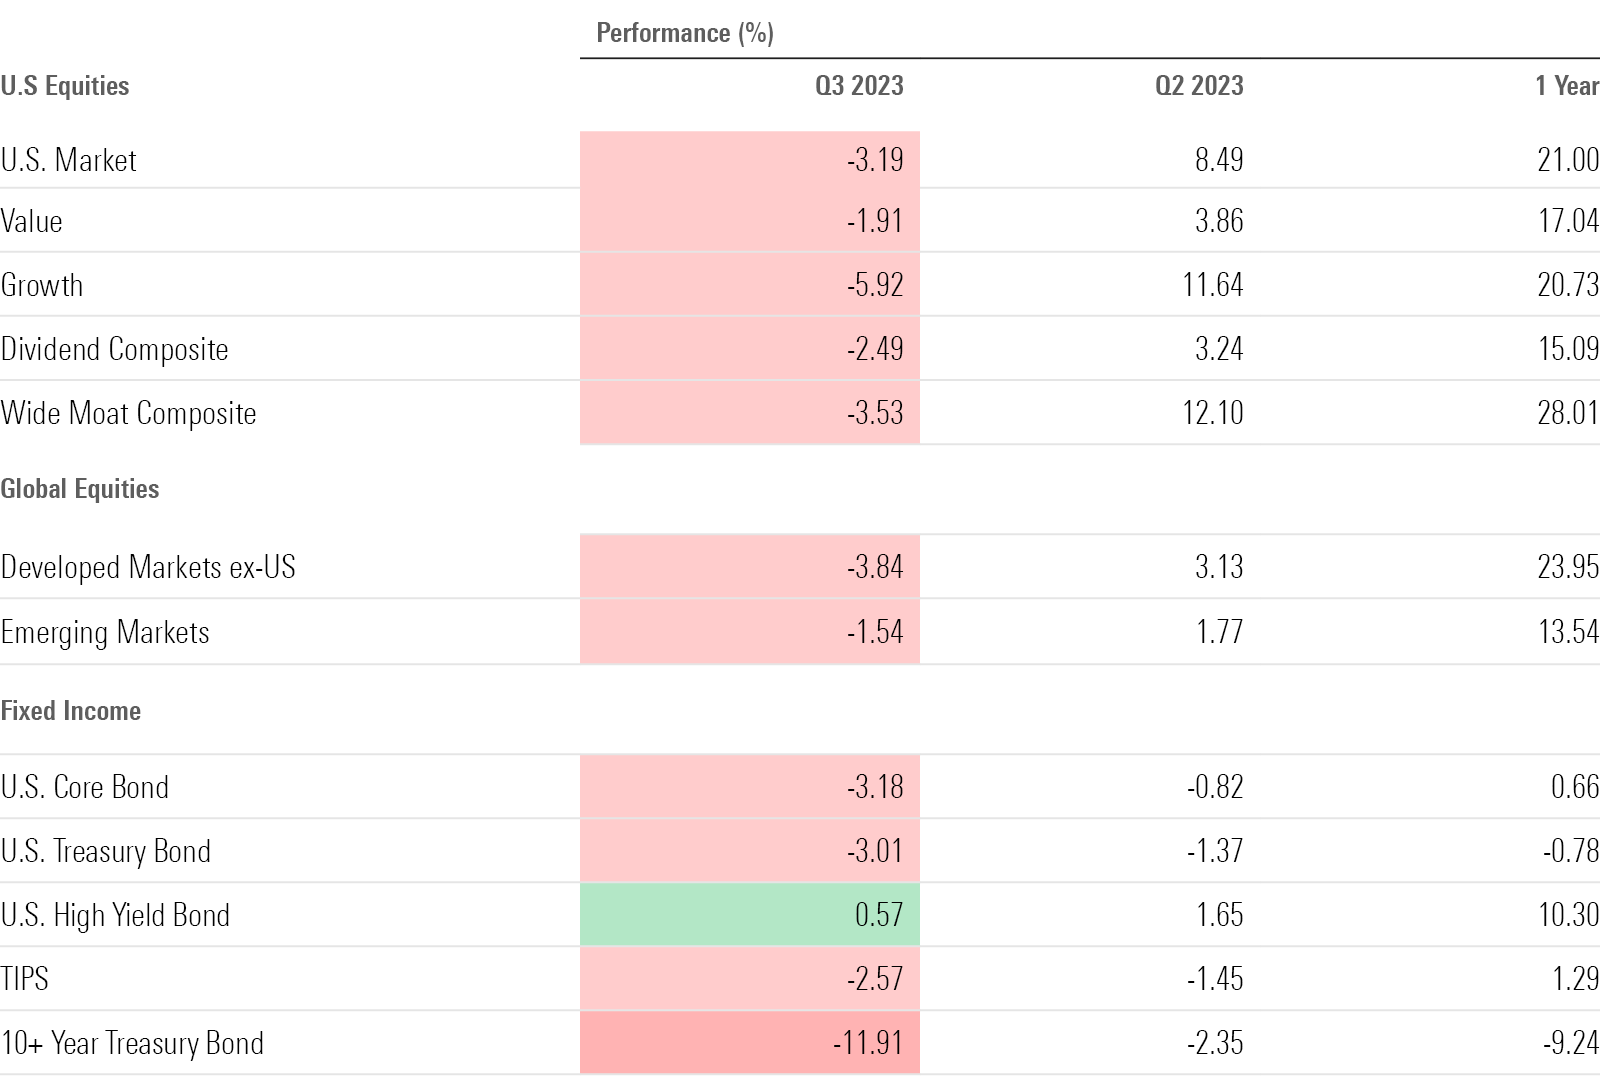
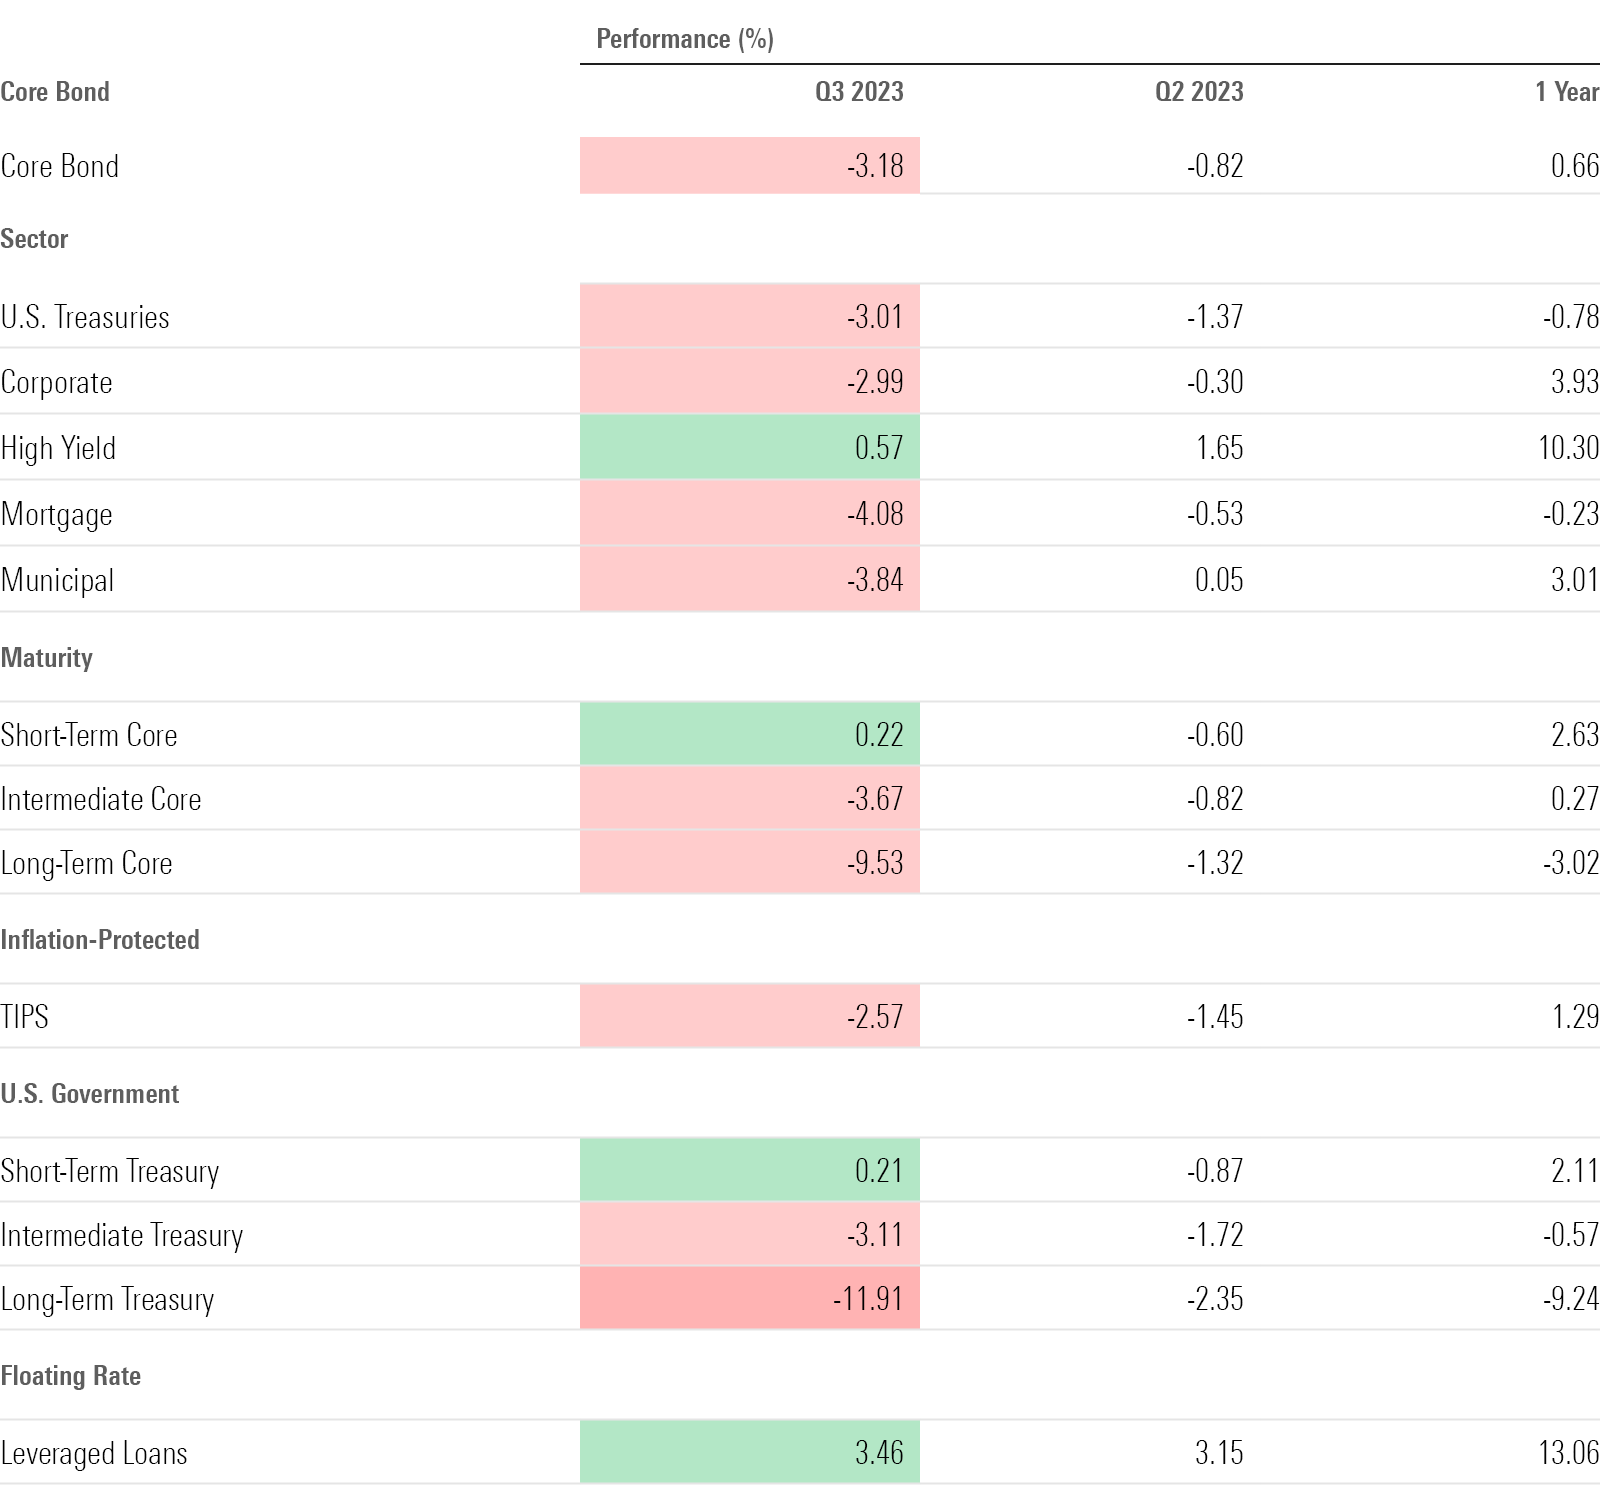
High-yield, short-term bonds kept afloat during the third quarter, while the rest of the fixed-income market (especially long-term bonds) took a hit from the Fed’s higher-for-longer stance on interest rates.
The broad-based Morningstar US Core Bond Index lost just over 3%—its biggest quarterly loss since the third quarter of 2022, when many bond funds posted their worst losses ever.
As yields rose to their highest levels since 2007, interest-rate-sensitive Treasury bonds were beaten down. Adding to the pressure on the Treasury market was the U.S. government’s announcement at the end of July that it needed to sell substantially more debt than investors expected.
Long-term bonds—those due in 10 years or more, whose longer durations make them the most sensitive to interest rates—were hit hardest. The Morningstar Long-Term Treasury Bond Index fell 11.9% and the Morningstar Long-Term Core Bond Index lost 9.5% during the third quarter. On the flip side, high-yield bonds—which tend to be riskier and of lower quality than other kinds of fixed-income investments—made modest gains. High-yield bonds are generally less sensitive to changes in interest rates. The high-yield bond market has also proven resistant to the recent in bond yields, as many lower-quality companies are seen as less vulnerable to rising rates after refinancing much of their debt while rates were low.
Out of all of Morningstar’s key fixed-income indexes, floating-rate bonds performed best for the second quarter in a row. The Morningstar LSTA US Leveraged Loan Index ended the quarter up 3.5%, after rising 3.1% in the prior quarter. Leveraged loans have been performing well over the past several months, gaining 13.1% over the trailing 12-month period ending Sept. 30.
Morningstar Bond Indexes
Treasury Yield Curve Inversion Lessens
As yields across the spectrum of U.S. Treasuries rose over the third quarter, the yield curve remained inverted, although it’s less steep than it was a few months ago.
When short-term Treasury yields exceed long-term yields, it’s known as an inverted yield curve. It’s a sign of investor pessimism about the economy and is widely seen as a precursor to a recession. (Not all yield curve inversions lead to recessions, but historically all recessions have been preceded by an inversion of the yield curve.) Many analysts say that the longer the yield curve remains inverted, the more likely a recession becomes.
Short-term yields ended the third quarter of 2023 above long-term yields for the sixth quarter in a row. The yield on the U.S. Treasury 2-year note finished 0.44 percentage points above that of the 10-year note. While still inverted, the gap has narrowed significantly from its most recent high of 1.08% on July 3.
For now, the economy is still chugging along. However, economists say a recession may still be further out on the horizon. An inverted yield curve with rising real yields has implications for the economy. It creates a disincentive for banks to lend (when short-term rates are higher than long-term rates, loans are generally less profitable). With positive real yields, bonds offer a compelling, less-risky alternative to gaining returns through the stock market.
U.S. Treasury Yield Curves
Stock and Bond Market Volatility
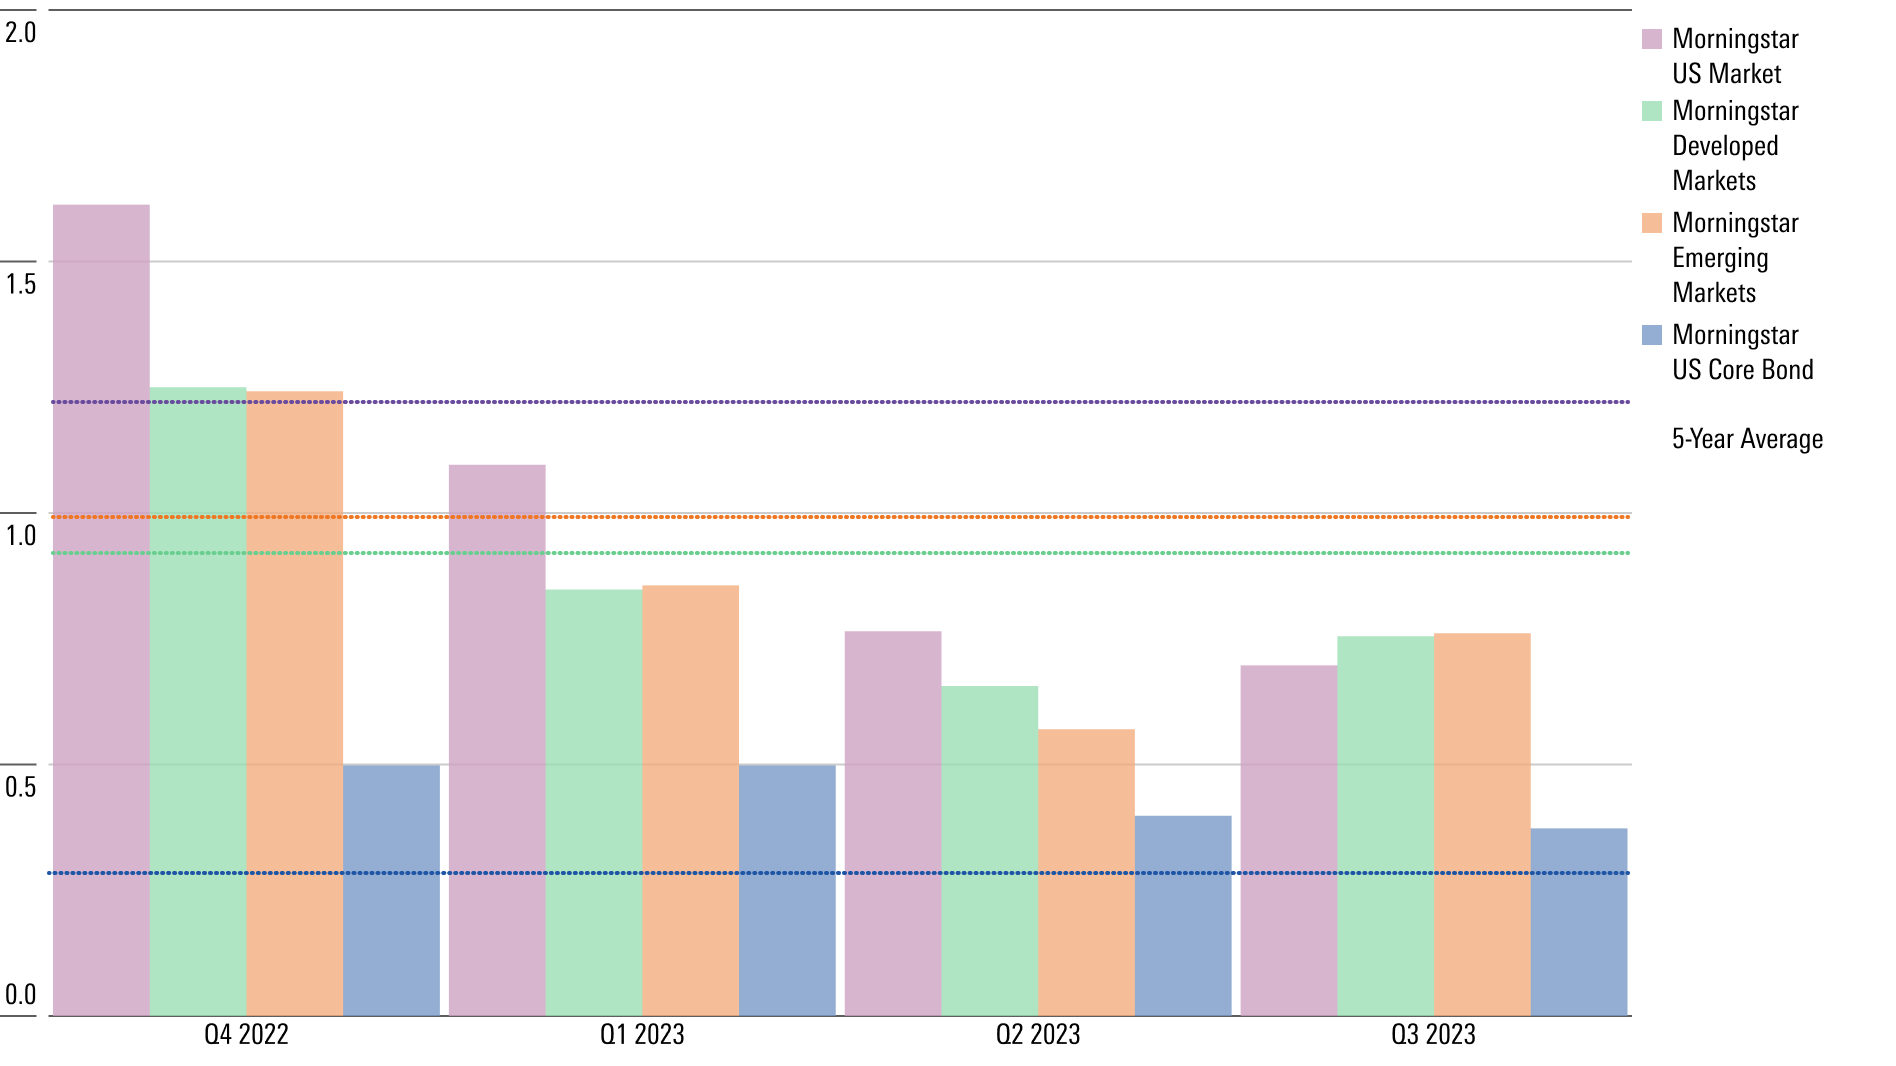
Stock price volatility remained below long-term trend levels, as the overall equity market held within a relatively narrow range in the third quarter. But it’s been a continued bumpy ride in the bond market thanks to shifting expectations about Fed policy, and the central bank’s hawkish stance hurts fixed-income performance.
Volatility in the bond market has remained at nearly twice its historical level for six quarters in a row—notable for a market that most investors look to for stability.
Historical Standard Deviation
Top and Bottom Market Performers of Q3 2023
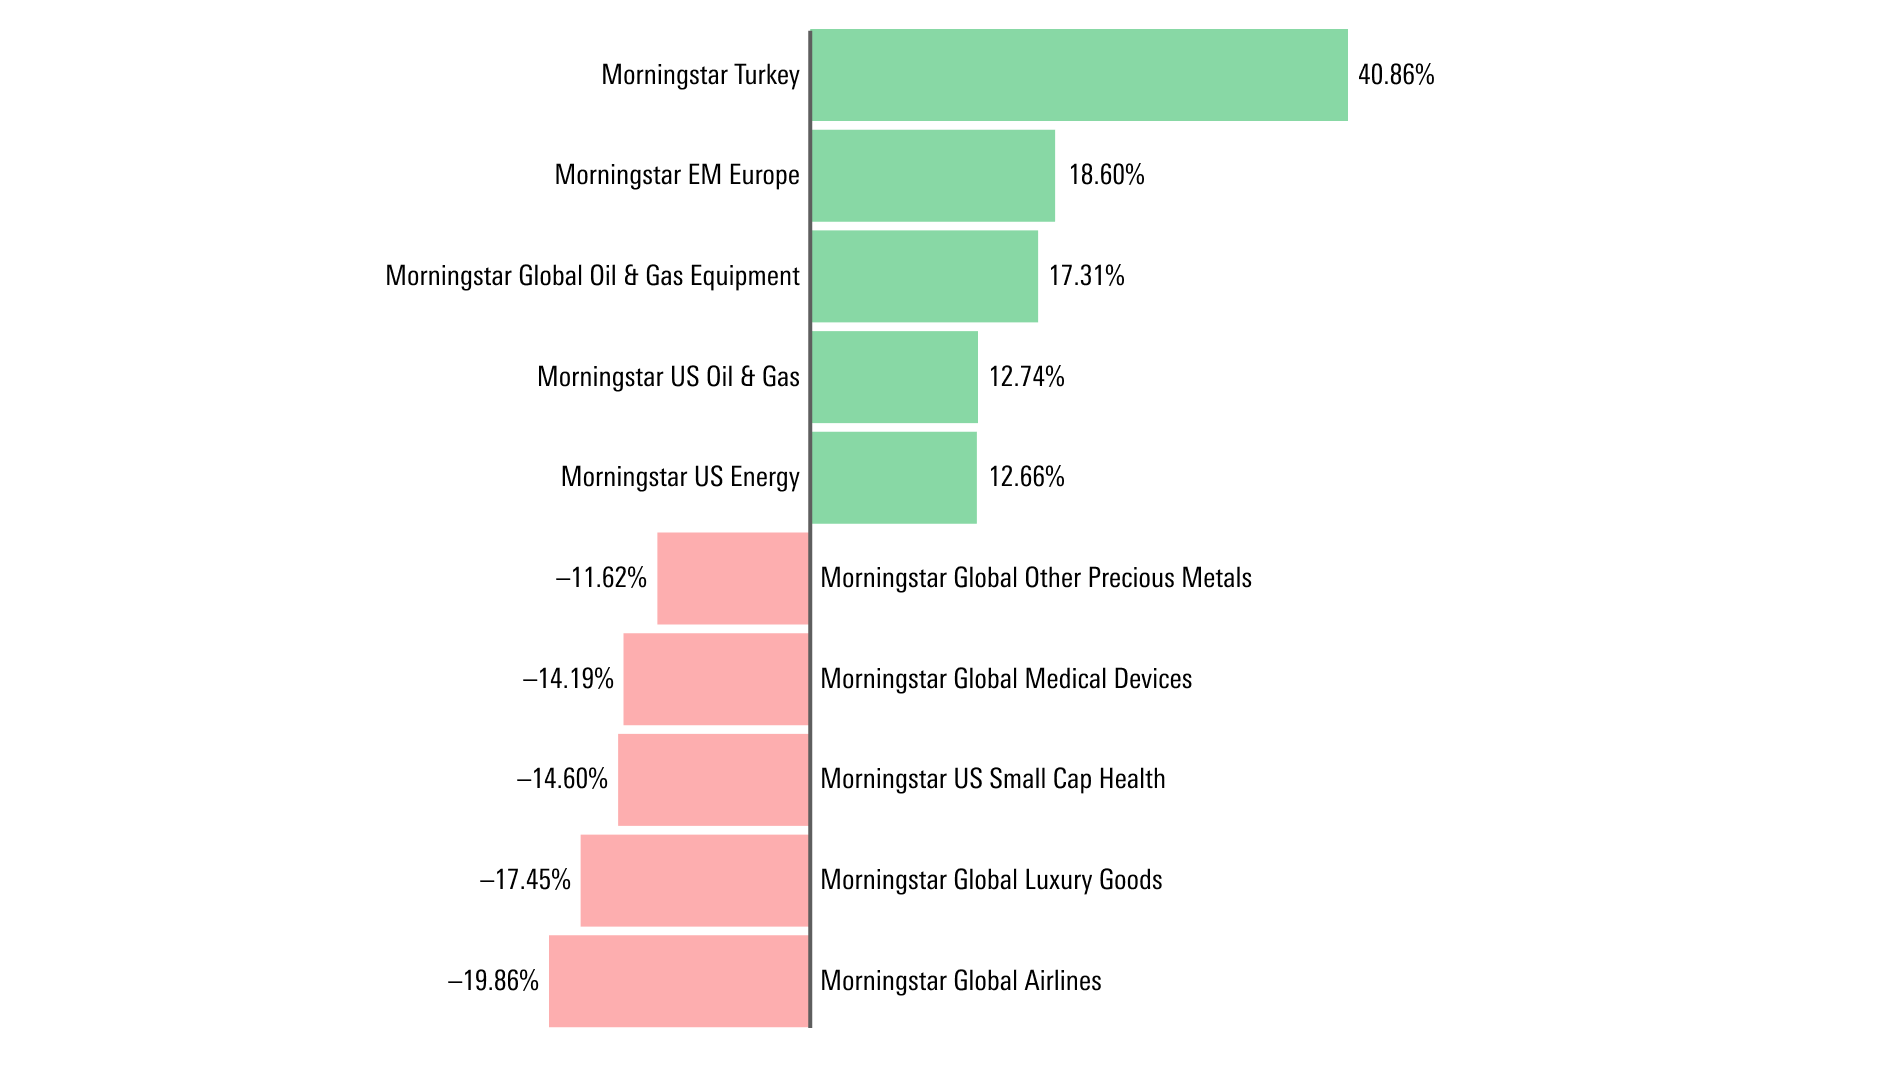
The Morningstar Turkey Index topped the list of winners for the third quarter, gaining 40.9%. Returns were driven by declines in the lira amid the country’s pivot to tightening monetary policy. In 2022, the Turkish central bank slashed interest rates even as inflation raged. The Morningstar Emerging Markets Europe Index was also a top gainer for the quarter, lifted by the strong performance of Turkish stocks.
Energy-related indexes were also key high-fliers for the quarter, supported by rising oil prices. The Morningstar Energy Index rose higher than all other U.S. equity sectors over the quarter. At the industry level, oil and gas exploration and production companies led the energy space. The Morningstar US Oil and Gas Exploration and Production Index’s strong gains were led by ConocoPhillips COP and EOG Resources EOG. The Morningstar Global Oil and Gas Equipment Index—which includes providers of tools and services for drilling, seismic surveys, equipment and tool rental, and pumping/processing services—also made double-digit gains.
While energy indexes across the globe rose on the back of oil prices, airline stocks took a hit. The Morningstar Global Airlines Index lost roughly 20% as fuel prices increased.
The Morningstar Global Luxury Goods Index was also among the biggest losers for the quarter, with double-digit losses. Luxury sector valuations are now closer to Morningstar’s fair value estimates, driven lower by investor concerns about the Chinese economic recovery and U.S. demand weakness.
Q3 2023 Highlighted Top and Bottom Performers
Commodity Market Performance
Oil prices rose during the third quarter, driven upward by ongoing supply cuts. Elsewhere in the commodities space, both gold and copper languished.
Crude oil prices (WTI) rose above $90 per barrel in September for the first time since November 2022, as both Saudi Arabia and Russia extended supply cuts. Rising oil prices boosted energy stocks over the quarter, and Morningstar analysts now see the sector as fairly valued.
“With less than 20% of our energy coverage undervalued, investors are clearly underwriting a higher-for-longer oil price scenario, and have already assumed that poor gas market conditions in 2023 and 2024 will reverse over the long run,” write Stephen Ellis and Adam Baker. Their long-term forecast continues to be $55 per barrel.
Copper futures hovered around the zero mark for much of the quarter but ended in negative territory. Copper—a common input for equipment and products in a wide range of industries—is seen as a bellwether for the global economy.
Gold prices also showed little movement over the third quarter. In recent research, Morningstar portfolio strategist Amy Arnott writes that gold has been a winning asset class during past recessionary periods, with positive returns during the eight most recent recessions since 1993. “But the yellow metal had a relatively anemic showing during recessions in the early 1980s and early 1990s; returns were negative after inflation.”
Commodity Futures Performance
Cryptocurrency Performance
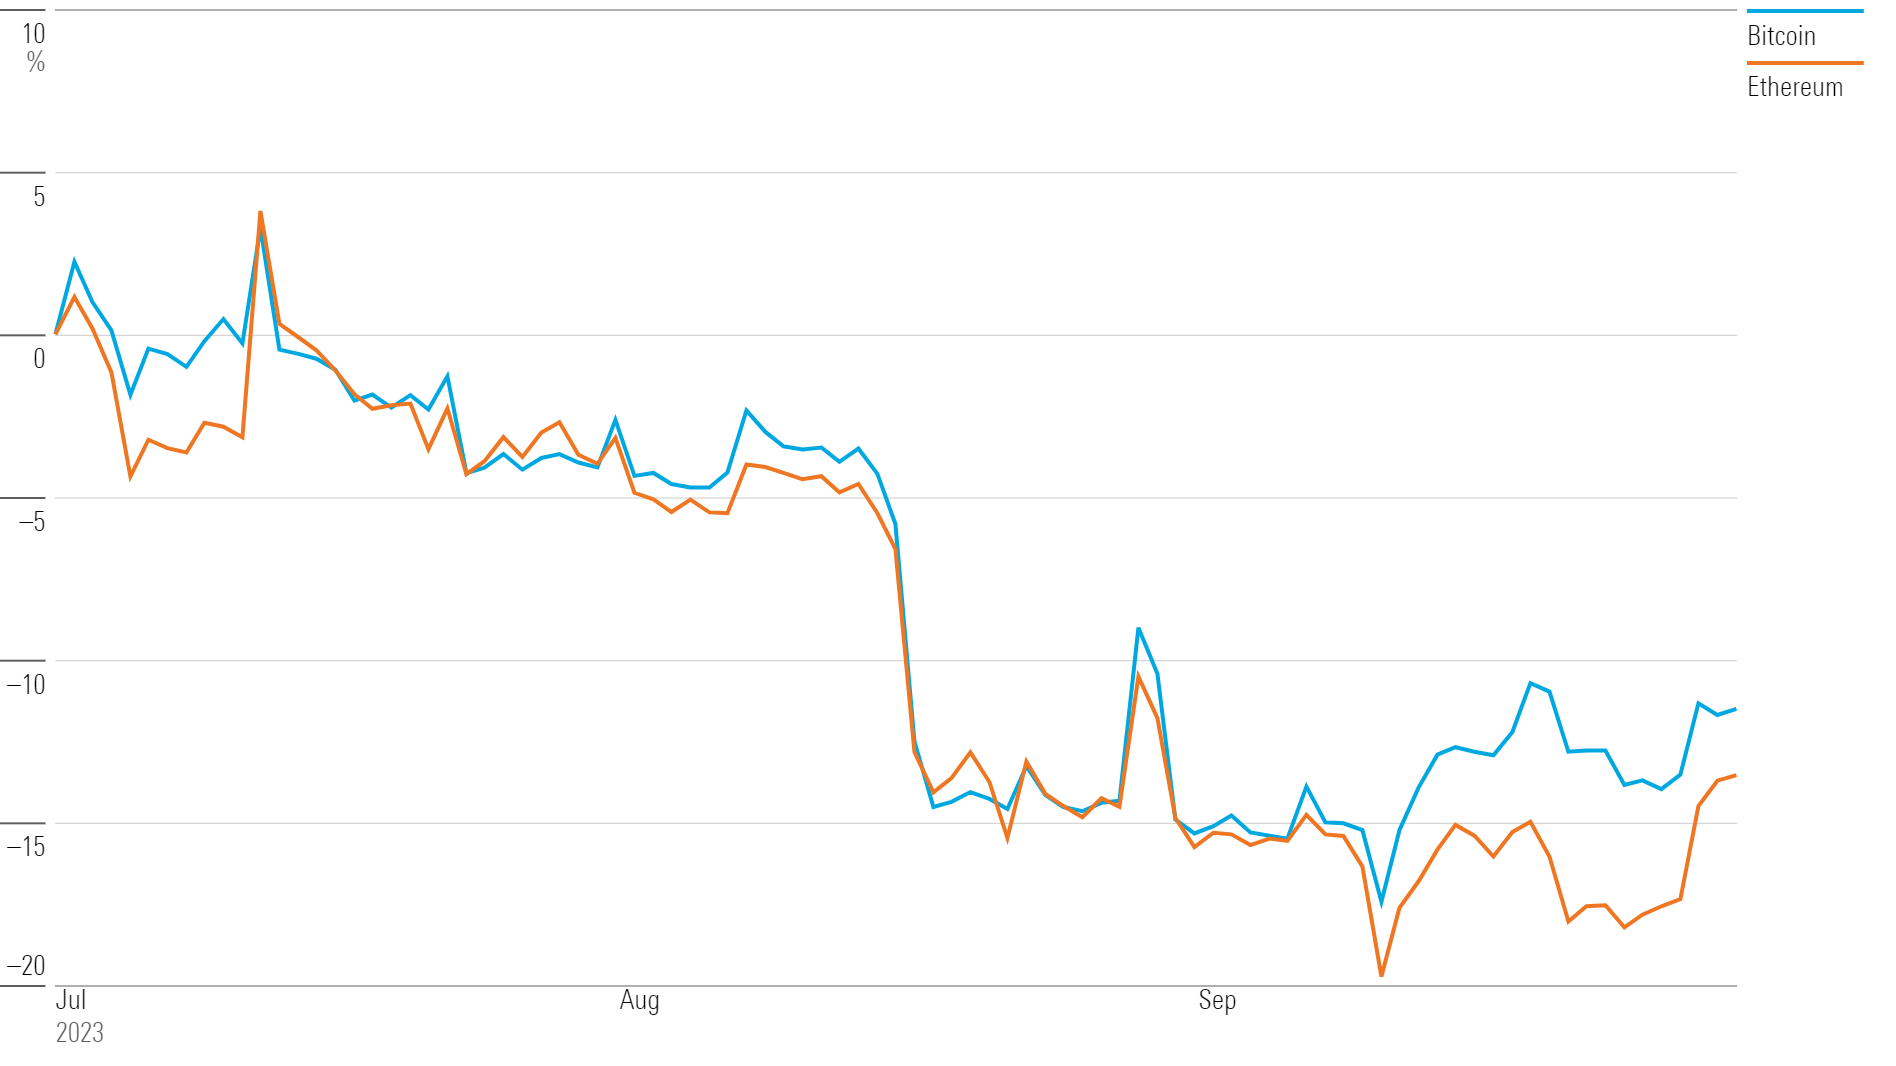
Major cryptocurrencies lost ground in the third quarter after making substantial gains during the first half of the year.
The two largest cryptocurrencies by market cap, bitcoin BTC-USD and ethereum ETH-USD, each ended the quarter down roughly 12%. For the calendar year so far, bitcoin is still up 68.3% and ethereum is up 40.2%—a reversal from 2022, when both lost over 65% each.
Over the past 10 years, bitcoin has been over 16 times more volatile than a common benchmark for the diversified portfolio, writes Morningstar senior research analyst Madeline Hume. “That means that even a smidge of bitcoin changes the behavior of an investor’s portfolio a whole lot,” she writes, “Like caviar or dynamite, a little bit of bitcoin goes a long way.” As legal turbulence continues in the space, Morningstar analysts recommend that investors treat cryptocurrency assets as sunk costs.
Cryptocurrency Performance
The author or authors own shares in one or more securities mentioned in this article. Find out about Morningstar’s editorial policies.
/cloudfront-us-east-1.images.arcpublishing.com/morningstar/RMBMMBAVABHL5O5JI2WDI44I3U.jpg)
/cloudfront-us-east-1.images.arcpublishing.com/morningstar/KIQMCCUZ2RGWZKSCKM2Z4ZULFU.png)
/cloudfront-us-east-1.images.arcpublishing.com/morningstar/MJ3FSXZXVFDYPHHGXT7LMKSZD4.png)
:quality(80)/s3.amazonaws.com/arc-authors/morningstar/ba63f047-a5cf-49a2-aa38-61ba5ba0cc9e.jpg)