
What Is Shareholder Yield?
The promises and pitfalls of this emerging investment factor.
/s3.amazonaws.com/arc-authors/morningstar/5db00d6b-9c2f-4da7-8f94-da4290cf3b4a.jpg)
Shareholder yield. Total payout. Total yield. These different labels represent the same thing—return of capital to shareholders. There are nuanced definitions to each, but the common thread is buybacks and dividends. Simplified, their calculation can be thought of as:
Shareholder yield = net buyback yield + dividend yield
There are two primary ways companies return cash to shareholders: buying back shares and paying dividends. Buybacks are less direct but more tax-efficient, and dividends are more direct but tax-inefficient. Flexibility and tax efficiency helped buybacks become the dominant form of shareholder payment.
Buybacks Grow Share of S&P 500 Total Yield
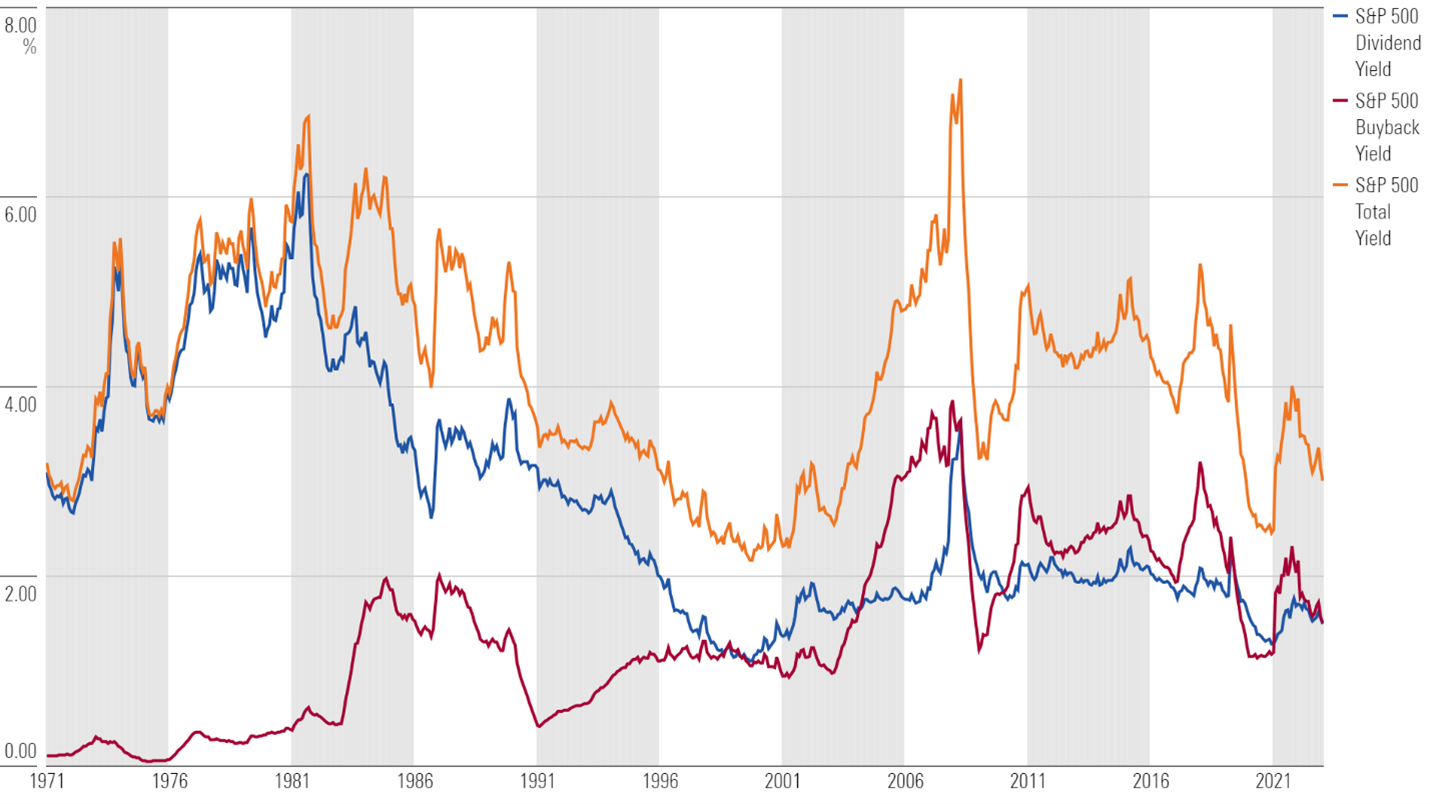
Dividends are well understood, liked by investors, and widely used as a primary input for predictive stock models. For decades, it was the only way public companies returned free cash flow to investors. Paying a dividend and raising it every year sends a strong positive signal to the market, while cutting it has the opposite effect. For firms already paying a dividend, this makes its continued usage almost mandatory. For firms not paying a dividend, initiating one may open up a new swath of income-seeking investors, but at the cost of losing flexibility for deploying free cash flow.
Enter buybacks. For investors that don’t require a steady stream of dividend income, buybacks may be a more appealing form of shareholder payment.
Pros and Cons of Dividends, Buybacks, and Shareholder Yield
When a company pays a dividend, it uses a portion of its free cash flow to make periodic cash payments to investors. Free cash flow measures how much profit a company has left over after paying its operating expenses and capital expenditures. Profit used to make the payment is taxable for the firm, and dividend income is taxable for the investor. This is known as the double taxation of dividends.
When a company buys back shares, it uses a portion of its free cash flow to buy shares of its own stock on the open market, reducing the amount of shares outstanding. Shareholders benefit from this by seeing their share of company ownership increase without buying more stock. Profit used to buy back shares is taxable for the firm, along with a small tax on the buyback itself. (Introduced in 2022, corporations must pay a 1% tax on most stock buybacks. Despite opposition, there is appetite from some lawmakers to increase this tax.) The transaction is not taxable for the investor.
Investors treat dividends and buybacks very differently. The tangible dividend payout and positive signal associated with them puts a moat around their perpetual payment. Companies sometimes move mountains to continue paying dividends once they’ve started, even if it’s not the optimal capital allocation decision at the time. Buybacks allow companies to deploy cash more strategically.
Buybacks are a relatively new phenomenon and draw less investor scrutiny than dividends. There’s no market force preventing companies from being opportunistic when repurchasing shares, so they are. Companies buy back shares when they’re cheap, when there’s extra cash, or to offset dilutive stock-based compensation, among other reasons. The result is fluctuating buyback activity from firm to firm and year to year.
Shareholder yield ignores how companies deliver cash to shareholders and instead considers the combined return of value from dividends and buybacks.
Researchers Roger Ibbotson and Philip Straehl show in their 2017 report, The Long Run Drivers of Stock Returns: Total Payouts and the Real Economy, that the prevalence of buybacks in the US market cause traditional dividend discount models to underestimate expected stock returns, making a total payout model (net buybacks + dividends) more predictive.
The researchers found that the long-run supply of total payouts almost entirely explains realized returns from 1871 through 2014. Following this logic, companies with a high total payout should outperform those with a lower total payout.
Trailing Factor Premiums (%)
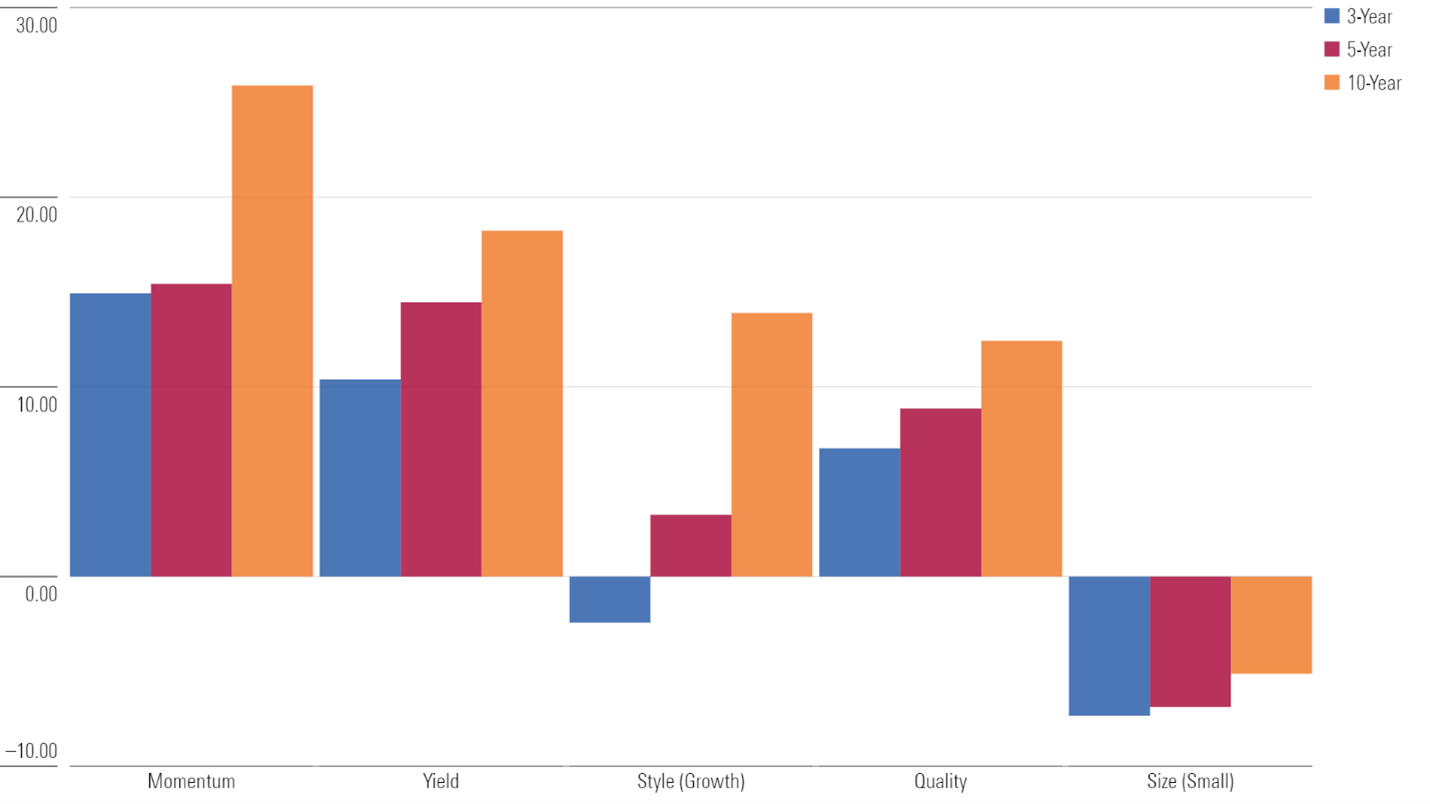
Indeed, the Morningstar Risk Model shows a positive historical premium for the yield risk factor—which includes net buyback yield and dividend yield—suggesting that portfolios with exposure to this factor have performed well.
Applying Shareholder Yield
The stable of shareholder yield exchange-traded funds is thin, and few have gained much traction.
Led by Cambria Shareholder Yield ETF SYLD, Cambria offers five shareholder yield ETFs. Each uses a rules-based active approach to collect stocks trading cheaply with a high total yield. WisdomTree also offers a rules-based active shareholder yield ETF: WisdomTree US Value ETF WTV. First Trust Bloomberg Shareholder Yield ETF SHRY and iShares Core Dividend ETF DIVB are the only two index-tracking shareholder yield ETFs available to US investors [1].
These eight ETFs claim just $2.9 billion.
Only 8 Shareholder Yield ETFs Are Available to US Investors
| ETF | Ticker | Fee | Inception Date | Category | AUM ($Mil) |
|---|---|---|---|---|---|
| Cambria Shareholder Yield ETF | SYLD | 0.59% | 5/13/2013 | Mid Value | 1,273 |
| Cambria Emerging Shareholder Yield ETF | EYLD | 0.66% | 7/13/2016 | Diversified Emerging Markets | 437 |
| iShares US Core Dividend ETF | DIVB | 0.05% | 11/7/2017 | Large Value | 418 |
| WisdomTree US Value ETF | WTV* | 0.12% | 2/23/2007 | Large Value | 335 |
| Cambria Foreign Shareholder Yield ETF | FYLD | 0.59% | 12/2/2013 | Foreign Smid Value | 327 |
| Cambria Micro & SmallCap Shareholder Yield ETF | MYLD | 0.59% | 1/3/2024 | Small Value | 39 |
| First Trust Bloomberg Shareholder Yield ETF | SHRY** | 0.60% | 6/20/2017 | Large Blend | 20 |
| Cambria Large Cap Shareholder Yield ETF | LYLD | 0.59% | 7/11/2024 | Large Value | 6 |
Source: Morningstar, company websites. Data as of July 31, 2024. *WisdomTree US Value ETF switched to current strategy on Dec. 18, 2017. **First Trust Bloomberg Shareholder Yield ETF switched to current strategy on March 4, 2024.
Research suggests shareholder yield can be a driver of long-term returns but applying it as a practical investment strategy can be tricky. Each shareholder yield ETF noted here follows a strict set of portfolio construction rules to capture the yield factor and control risk.
Portfolio construction rules must account for the numerous risks a shareholder yield approach invites:
- Value and yield trap risk—Stocks with a very high dividend or buyback yield may be concealing an impaired business with poor future prospects.
- High turnover risk—A stock’s total yield can vary substantially year to year because of fluctuating buyback activity, causing shareholder yield ETFs to cycle through holdings more frequently than many dividend ETFs or market-cap-weighted value ETFs. High turnover can raise transaction costs, which erode returns.
- Concentration risk—Market dynamics can cause certain sectors, industries, or countries to yield more than others from time to time. This causes shareholder yield ETFs to concentrate in high-yielding areas, regardless of associated risks.
Shareholder yield ETFs with insufficient risk control measures may experience a volatile return pattern, shifting style positioning, and severe drawdowns. Cambria’s suite of shareholder yield ETFs impose sector, country, and position caps to minimize concentration risk. The index underpinning iShares US Core Dividend ETF overweights dividends in its shareholder yield calculation because dividend yield is a more stable metric—a move that should reduce turnover. WisdomTree US Value ETF incorporates a quality screen to remove risky value or yield traps, and First Trust’s offering excludes stocks with a shareholder yield above 15% to do the same.
Each shareholder yield ETF has measures to control for risks inherent in its approach. Yet all tend to be more volatile than the market, value-oriented benchmarks, or dividend ETFs. There’s merit to a shareholder yield approach, but investors considering such ETFs should be comfortable with the risks they invite and understand how each ETF accounts for them.
[1] iShares US Core Dividend ETF DIVB tracks a Morningstar Index: Morningstar US Dividend and Buyback Index.
The author or authors do not own shares in any securities mentioned in this article. Find out about Morningstar’s editorial policies.
/cloudfront-us-east-1.images.arcpublishing.com/morningstar/NPR5K52H6ZFOBAXCTPCEOIQTM4.png)
/cloudfront-us-east-1.images.arcpublishing.com/morningstar/OMVK3XQEVFDRHGPHSQPIBDENQE.jpg)
/d10o6nnig0wrdw.cloudfront.net/09-24-2024/t_c34615412a994d3494385dd68d74e4aa_name_file_960x540_1600_v4_.jpg)
:quality(80)/s3.amazonaws.com/arc-authors/morningstar/5db00d6b-9c2f-4da7-8f94-da4290cf3b4a.jpg)