
Is Driving Doomed?
We don't think so. In fact, we think driver demographics bode well for auto sales.
/s3.amazonaws.com/arc-authors/morningstar/222a1c0d-911c-4064-ac93-f9d4516d0a06.jpg)
Total U.S. miles driven in 2020 declined 13.2% year over year to 2.83 trillion, the lowest total since just below 2.8 trillion in 2001. 2020 was only the fourth year-over-year decline of this century and the first since a 0.6% fall in 2011. The 13% year-over-year fall was by far the worst decline of the Federal Highway Administration's data available back through 1970, with the next worst being 2008's 1.9% decline. The 2020 drop was so bad that we calculate it lowered the compound annual growth rate in U.S. miles driven to 1.9% for 1970-2020 from 2.2% for 1970-2019.
U.S Miles Driven Plummeted Because of the Pandemic
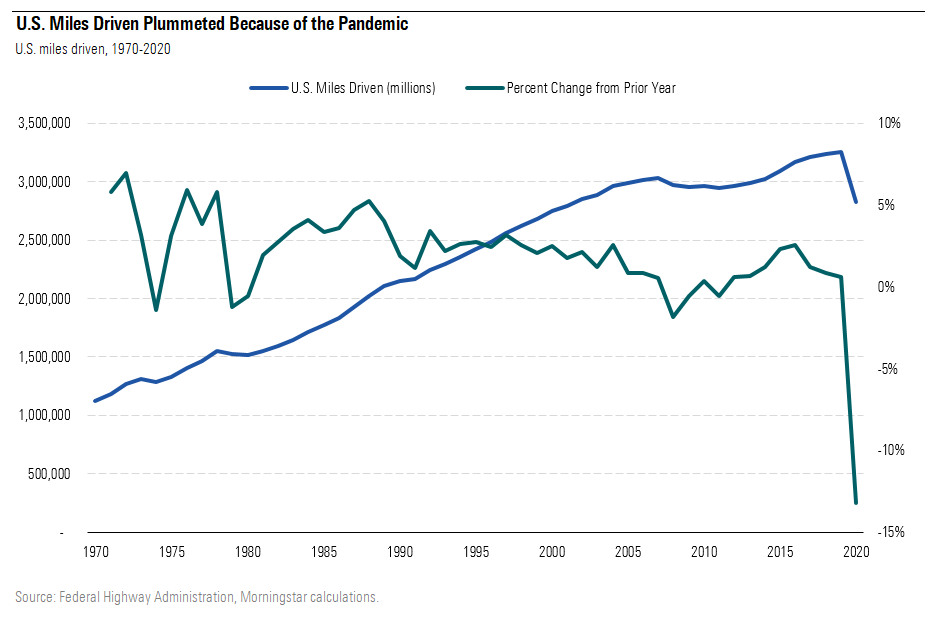
Obviously, the pandemic is to blame for 2020's collapse, and we do not believe driving is forever doomed. The New York Times reported that 970,920 drivers traveled through the city's tolls on May 27, according to New York City's Metropolitan Transportation Authority. This total was a level not seen since before the pandemic and represented about 96% of that day's traffic during a normal year. Many employers will require people to return to the offices that companies spend lots of money to provide, Americans are getting the vaccine, which should increase demand for travel for reasons other than commuting, and the vehicle-dependent suburbs are more in demand than some people may think.
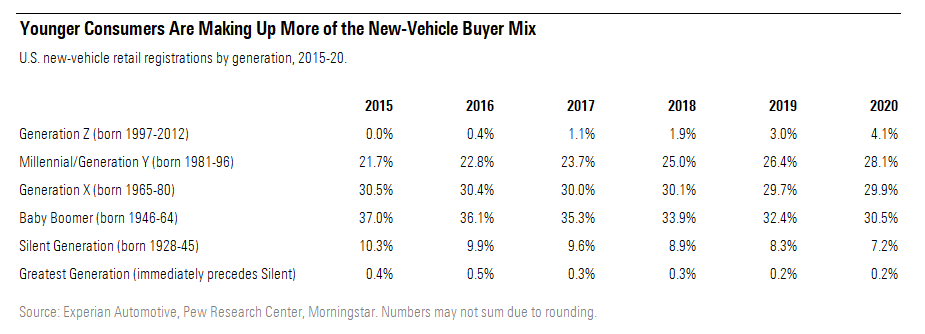
Demographics to us still support people wanting vehicles. Outgoing AutoNation CEO Mike Jackson has repeatedly stressed on earnings calls since the pandemic began that Americans want their own space for mobility for health reasons. Commuting data from the U.S. Census Bureau shows driving alone is by far the preferred way for Americans to get to work. And younger consumers, such as millennials and Generation Z, continue to make up more of the new-vehicle buyer mix each year.
Younger Consumers Are Making Up More of the New Vehicle Buyer Mix
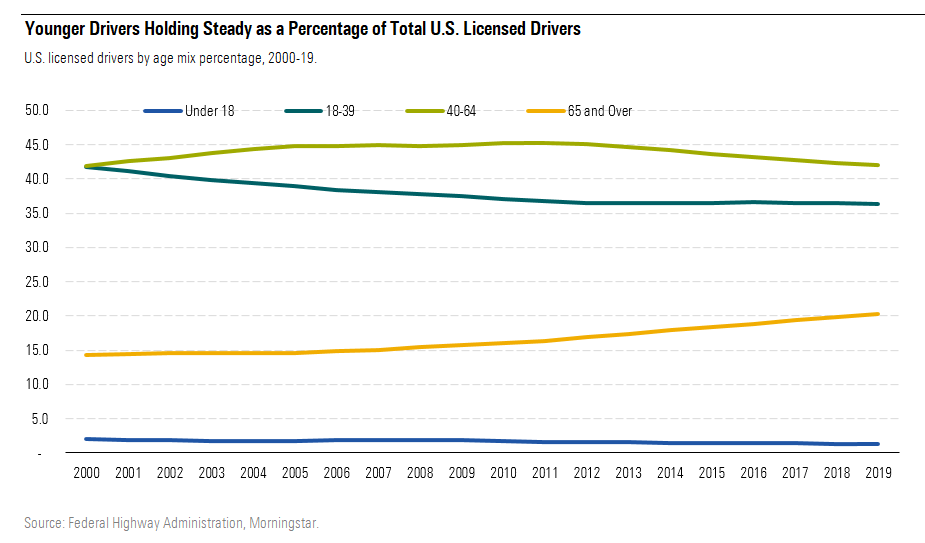
When we look at the age breakdown for all U.S. licensed drivers through the most recent year's data available, 2019, the proportion of licenseholders under age 39 is 37.7%, not drastically different from 37.9% in 2015. The bucket for under age 18 has held steady at 1.4% of all licensed drivers for every year back through 2014. The only noticeable shift in this data set since 2015 is that the mix of drivers age 65 and over has increased by 180 basis points since 2015 to 20.2%. This increase came at the expense of licenseholders between age 40 and 64, which saw its mix over the same time frame fall 170 basis points to 42.0%. An aging population may be to blame. We calculate using the FHWA's data (which is tied to U.S. Census Bureau's age bracket data) that the total U.S. population age 40-64 (licensed and nonlicensed) decreased 1% for 2019 versus 2015 to 103.3 million, while the total population age 65 and up increased 15.8% to 54.2 million.
Younger Drivers Steady as a Percentage of Total U.S Licensed Drivers
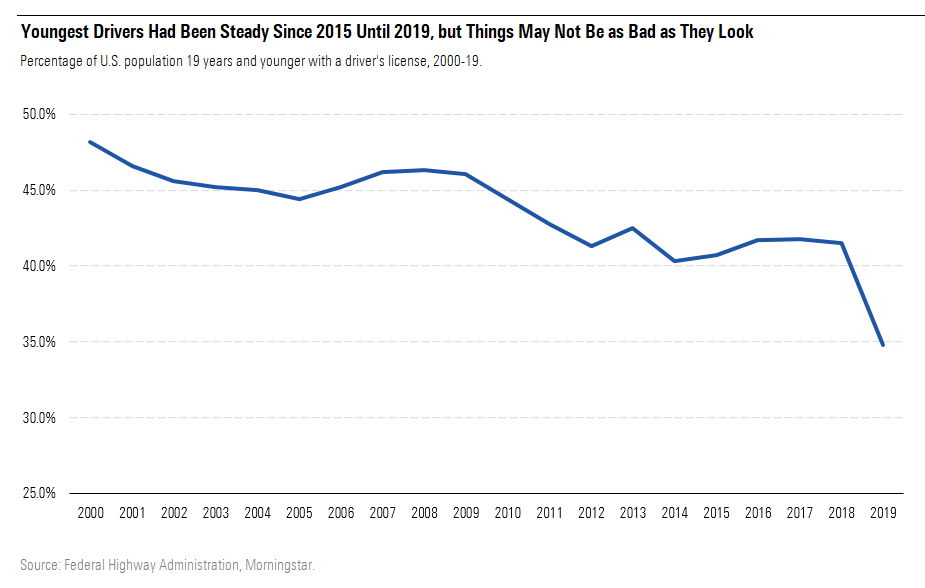
Focusing on drivers 19 and younger paints a less optimistic demographic picture. We have long argued that teenagers' desire to get a license had been falling before the rise of smartphones, and we stand by that view because the data shows a decline before that technological advancement. The Great Recession was not kind to young people, either, with the data showing a noticeable falloff in the youngest drivers (19 or younger) getting licenses at that time. FHWA data actually showed growth for 2016-18. The 2015 penetration of 40.7% of those 19 and younger with a license increased to 41.7% in 2016 and to 41.8% in 2017 before falling 30 basis points to 41.5% in 2018. However, 2019 was a collapse, with a year-over-year decline of 670 basis points to 34.8%.
Our research over the years has found many possible reasons for the continued decline in teenagers getting licenses, but it seems no one has a definitive answer. Likely factors are kids that are busy playing video games or doing other activities in and out of school, the ability to get rides from parents and friends, ride-hailing services (even though Uber and Lyft require a rider to be at least 18), the expense of having a vehicle, and anxiety brought on by driving. But you can't ask friends and family for rides forever, and eventually (assuming telecommuting does not take over), we believe these teenagers will eventually get "real" jobs and for the most part need to drive to them (as of 2019, just over three fourths of Americans commute by driving alone, per census data), so we are not worried that demand for vehicles will evaporate over the next decade.
The other factor possibly mitigating the decline in teenage licenseholders is a strange rate of change in the FHWA's data for the age bracket it labels as under 16 (you can get a learners permit in several U.S. states at age 14, and some states issue licenses to people under 16 for special reasons or for a certain time of year). Using the FHWA's data of number of licensed drivers for each age category (under 16, 16, 17, 18, and 19), we calculate that the change for 2019 compared with 2018 is a low-single-digit rise or fall in the total population of that age for nearly every one of those age buckets. However, for the under-16 group, we calculate the total population more than doubled in one year to nearly 8.8 million people. We don't think that makes sense, as it's unlikely that age group would more than double in one year. If we used the 2018 total under-16 population for 2019, 2019's 19 and under 34.8% data point would increase to 41.4%, turning a nearly 700-basis-point decline from 2018 to a mere 10-basis-point decline. The FHWA's footnote for Table DL-20 in its 2019 Highway Statistics Series says that the percentage of a total age group population that has a license uses estimates from the Census Bureau for that calculation and that, "for computational purposes, the under 16 age group data is compared to 14- and 15-year-old population estimates; the other age brackets coincide with those from the Census Bureau."
We interpret this to mean there is some major subjectivity to the under-16 age bucket, which may have caused the large year-over-year decline for 2019. We asked the FHWA for clarification on the decline and its methodology. The response was that the data comes from each state and some states did include learners permits in their data. The FHWA also told us, "We reached out to those states to identify the cause while assisting with resolution to correct it….We have recently initiated efforts to enhance our data quality control procedures with high expectations for data quality improvements moving forward."
This response suggests to us that the under-16 category for 2019 may have errors and that the drop in people 19 and under getting a license is not the large decline reported. Other age buckets within the 19 and under grouping don't show a massive falloff in the mix of these ages having a license. There is also a noticeable increase in the mix of 18- and 19-year-olds who have a license compared with 16- and 17-year-olds, which may correspond to mobility needs changing drastically once someone finishes high school. In 2019, FHWA data says 70.9% of 19-year-olds had a license and 61.6% of those age 18 had a license. This is notably higher than 26.2% and 47.2% of 16- and 17-year-olds, respectively, having a license. We believe young people are delaying, not permanently putting off, getting a license, and the move to the suburbs after the pandemic may help reverse or at least slow or stop the decline of young people not getting licenses.
Youngest Drivers Had Been Steady Since 2015 Until 2019, but Things May Not Be as Bad as They Look
Millennials are moving to the suburbs more than some would think, given all the media coverage in the years before the pandemic that said they only wanted to live in cities--a premise that data in recent years has shown to be false. We gathered census data that supports the idea that millennials are leaving cities, especially the largest ones.
We used census data to identify the 37 largest U.S. cities in 2019 by total population, which is every city with a total population of at least 500,000. This data is only for the city rather than for an entire metro area to capture whether young adults are leaving the city itself. In the following table, city population data by age bucket is shown for every year between 2010 and 2019 (2020 data is not yet available). The 20-39 age range is roughly equivalent to millennials in the latter years of the data, who in 2019, for example, would have been between 23 and 38. During the early years of the decade, the 20-39 age range was more balanced between millennials and Generation X.
Young Adults Have Been Leaving Cities for a While Before the Coronavirus
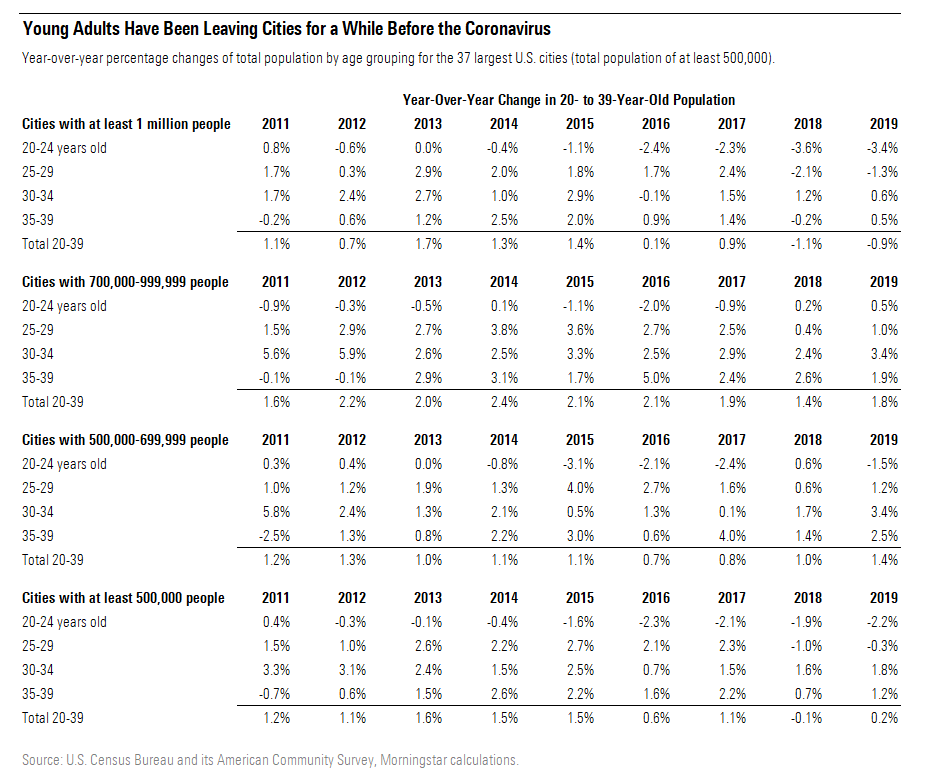
The table shows the exodus of adults under 40, especially from the top 10 cities (all the cities with at least 1 million people). We suspect this trend continued, if not accelerated, in 2020 due to the pandemic. For all 37 cities, 2018 is the first year that the total young adult population declined. 2016 and 2018-19, in particular, show notably less inflow than 2013-15, when the annual increase each year exceeded 200,000. Also noteworthy is that the 20- to 24-year-old group has declined every year since 2012, which suggests that many young people don't like the city, can't afford it, or have needs the city can't meet, and they move to a suburban or rural area that is more vehicle-dependent.
The 10 largest cities showed their first decline in younger adults in 2018, with three of the four age groupings showing a decline. For 2019, two of the four age buckets, covering all people in their 20s, showed a decline. In 2018, the largest cities lost 97,223 younger residents, but the younger population in smaller cities increased by 75,162 (or about 77% of the outmigration from the largest cities). In 2019, the 10 largest cities lost 73,137 younger residents, while the smaller cities' younger population grew by 100,251 people. However, looking at the 27 cities that have populations between 500,000 and 999,999, we believe only three have extensive public transit, such as a train system: Boston, San Francisco, and Washington, D.C. In our view, this move by younger people either out of cities completely or to smaller cities with inadequate public transportation is good news for auto demand for the next few years as the United States recovers from the pandemic-induced recession.
/d10o6nnig0wrdw.cloudfront.net/10-04-2024/t_e6175f671cee439d9180e460f6081183_name_file_960x540_1600_v4_.jpg)
/cloudfront-us-east-1.images.arcpublishing.com/morningstar/LE5DFBLC5VACTMC7JWTRIYVU5M.jpg)
/cloudfront-us-east-1.images.arcpublishing.com/morningstar/PJQ2TFVCOFACVODYK7FJ2Q3J2U.png)
:quality(80)/s3.amazonaws.com/arc-authors/morningstar/222a1c0d-911c-4064-ac93-f9d4516d0a06.jpg)