
Index Funds May Be Riskier Than You Think
Unpacking the risk/reward trade-offs of new indexes.
/s3.amazonaws.com/arc-authors/morningstar/78665e5a-2da4-4dff-bdfd-3d8248d5ae4d.jpg)


The composition of index funds has changed dramatically over the past 25 years, and not necessarily for the better. A typical index fund from the late 1990s tracked a broad index that held hundreds of stocks weighted by market capitalization. Such funds remain prominent, but they represent a smaller slice of the index funds available today. On average, today’s index funds have fewer constituents and employ a wider range of approaches to weight their holdings. Many look and perform meaningfully differently from their corresponding Morningstar Category indexes and their respective markets. They are passive in the sense that they track an index, but they are active in the risks they take and the rewards they seek.
Given these trends, investors need to understand the risk/reward trade-offs baked into an index fund’s underlying index. Our latest paper, “Mining for Alpha With Index Funds,” indicates the task is easier said than done. Most indexes have little historical data to work with. When launched, a typical index fund tracks a bogy that has existed for just a few months and has about 10 years of back-tested performance.
To make matters worse, a typical index’s back-tested performance often looks great, but it usually fails to live up to its historical expectations once it goes live. Within the sample of indexes used for this paper, most outperformed their corresponding category indexes before a fund started tracking them, but absolute and risk-adjusted performance subsequently declined in the years after they became the target of a fund.
From Revolution to Evolution
Index providers and asset managers have increasingly launched a wide array of benchmarks and funds that track them. Approximately 200 funds tracking stock and bond indexes existed in 1998, with that number rising to more than 2,000 by the end of 2022.
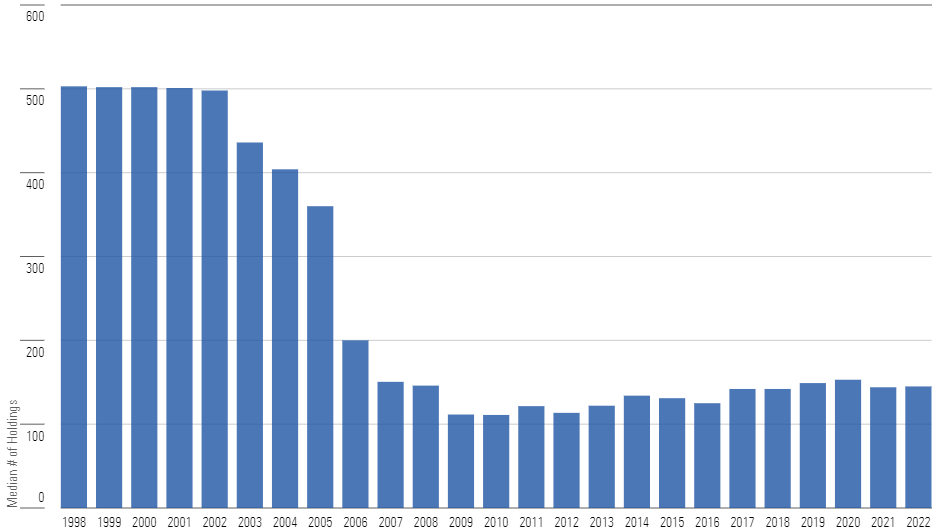
Despite impressive growth in the number of index-tracking funds, the underlying indexes today look very different from those available in 1998. For example, the breadth of a typical index-tracking stock fund has declined over time, as illustrated in the chart below. The median stock portfolio held around 500 stocks in 1998, but that number sharply declined between 2003 and 2007 before steadying over the most recent 15 years. The median number of holdings landed around 150 stocks by the end of 2022. Along the same lines, alternative approaches to weighting stocks and bonds have taken hold. Most indexes (85%) in 1998 weighted their stocks or bonds by market cap, but only a minority (42%) do so today.
New Indexes Have Fewer Holdings
Flying Blind
Historical index performance can help investors understand the risk/reward trade-offs of these new indexes. Live index performance usually provides more forward-looking insight than back-tested performance. It shows how the index’s underlying rules performed in a real-world proving ground outside of the back-tested period that informed their development.
Unfortunately, most indexes don’t have lengthy live track records when they become the target of a fund. The next chart shows the length of time between index launch and fund launch for 782 indexes from the wider sample.
Most Indexes Have Short Live Track Records When a Fund Adopts Them
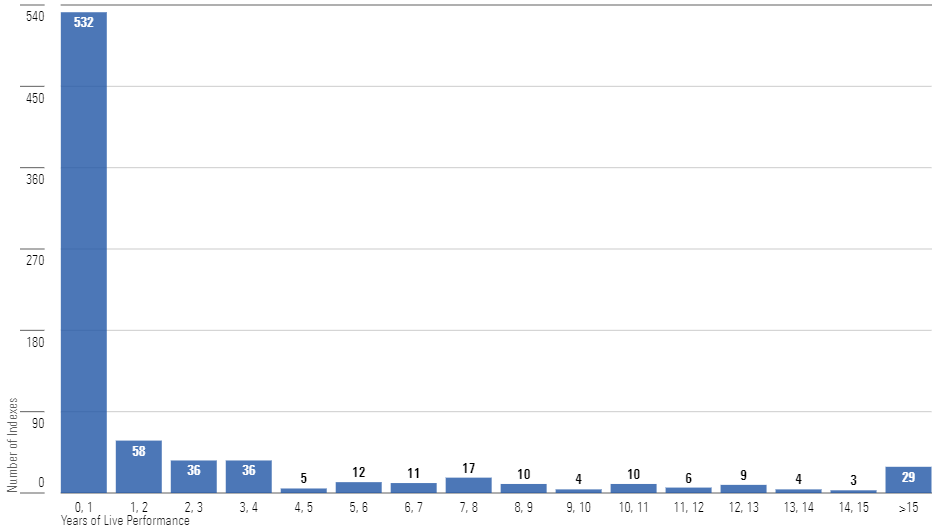
Shorter periods (one year or less) dominated the distribution. The median index had a little less than four months from the time it was launched until a mutual fund or exchange-traded fund started tracking it, and about one sixth of the indexes in the sample had fewer than 30 days. Said another way, investors placing money into new index funds must often rely on an index’s back-tested data, not its live performance, to gauge the trade-off between risk and reward. Most indexes tend to have lengthier back-tested performance. A typical fund’s track record goes back about 10 years.
Passive Funds Making Active Bets
Fewer holdings and alternative weighting approaches steer portfolios of stocks or bonds away from a broad cap-weighted portfolio. But how big are the differences?
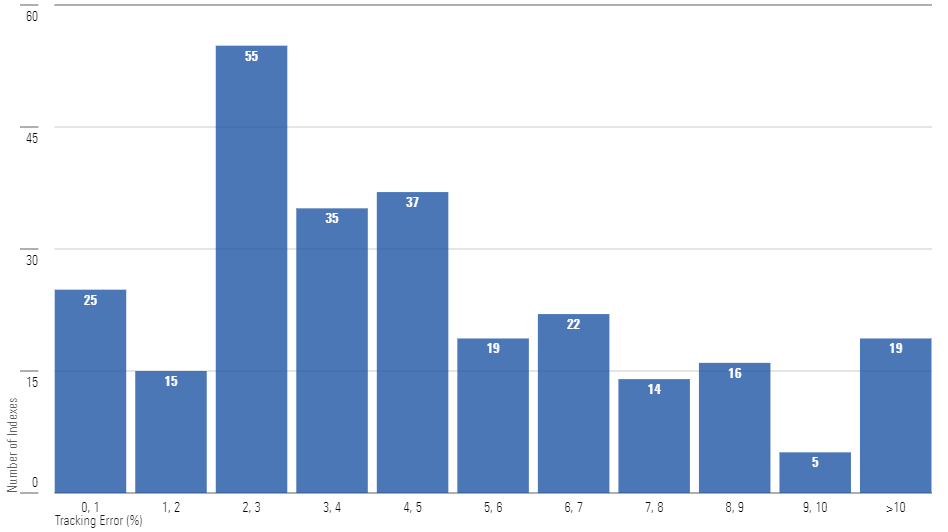
Tracking error, a measure of active risk, quantifies the gap by comparing an index’s performance against a benchmark. In the context of this paper, tracking error was calculated as the standard deviation of monthly tracking differences between a fund’s target index and its category index over the 60 months prior to the fund’s inception. All else equal, higher tracking error indicates an index is “more active” in the way it selects and weights stocks or bonds relative to its corresponding category index.
The next chart shows the distribution of tracking errors for a subset of indexes relative to their category indexes over those five years. Half of the indexes in this group had tracking errors north of 4%, and a third landed above 5%. To put that into context, tracking errors of about 2%-3% (or less) indicate that an index will probably hew close to its category index. While that’s not a line in the sand, performance deviations become more noticeable as tracking errors exceed that range.
The Active Side of Passive Indexes
Reality Check
High tracking error on its own isn’t necessarily bad because an index must differ from a benchmark if it’s expected to outperform. In that regard, back-tested index performance paints a rather rosy picture of these 262 indexes. Most of them (197, or roughly 75%) had annualized total returns that beat their corresponding category indexes over the 60 months prior to the launch of their fund. The next chart shows the distribution of these annualized excess returns skewed toward those with a stronger advantage over their category indexes.
Index Excess Total Return Prior to Fund Launch
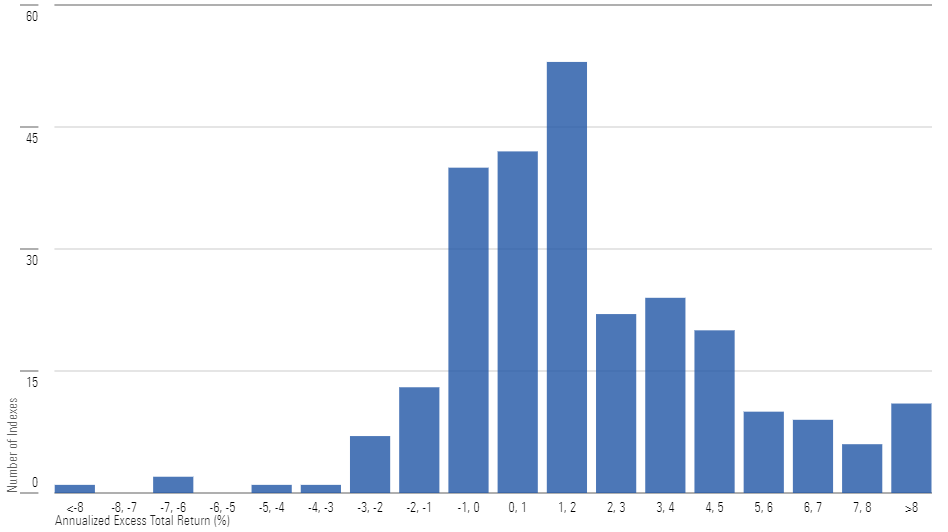
Said another way, the typical index in this subset appeared to benefit from at least some of its active risk. The median index beat its corresponding category index by 1.4 percentage points per year. Those that underperformed tended to trail by a comparably small amount, with most of the laggards underperforming by 1 percentage point per year or less.
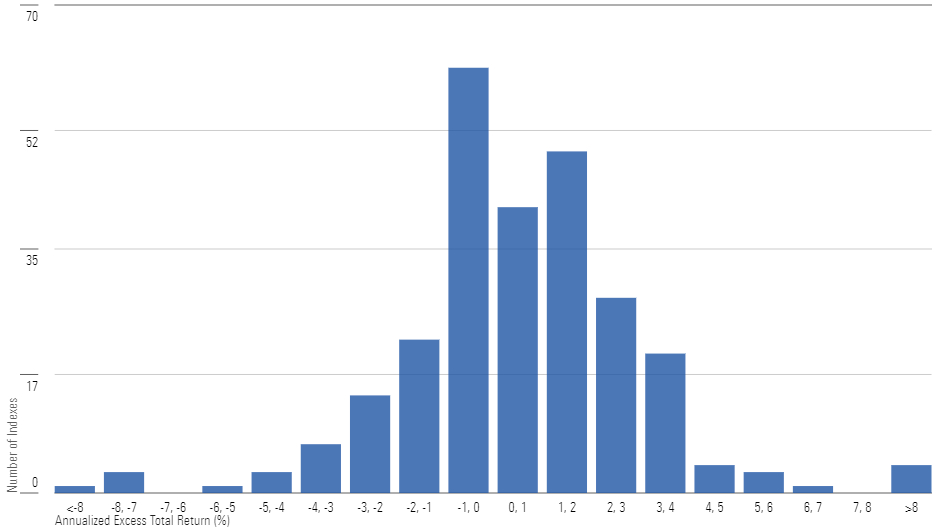
However, the performance of these same indexes over the subsequent five years looked quite different. A little more than half of the indexes in the sample (150 or about 57%) outperformed their category index over the 60 months after they became the target of a fund. But the median index’s advantage over those five years dropped to just 39 basis points per year. The following chart shows the distribution of annualized excess total returns more closely resembles a normal distribution rather than the skewed distribution in the previous exhibit. The same analysis using risk-adjusted returns yielded a similar result: The risk-adjusted return of a typical fund declined after a fund started tracking it.
Index Excess Total Return After Fund Launch
Winners and Losers Among Index Funds
An index’s performance prior to fund launch tended to overpromise what it actually delivered in both absolute and risk-adjusted terms. It also provided little information in determining which funds were more successful in gathering assets early in their lives. Similar observations resulted from plotting net flows against historical annualized excess total returns, historical tracking error, and length of back-tested returns.
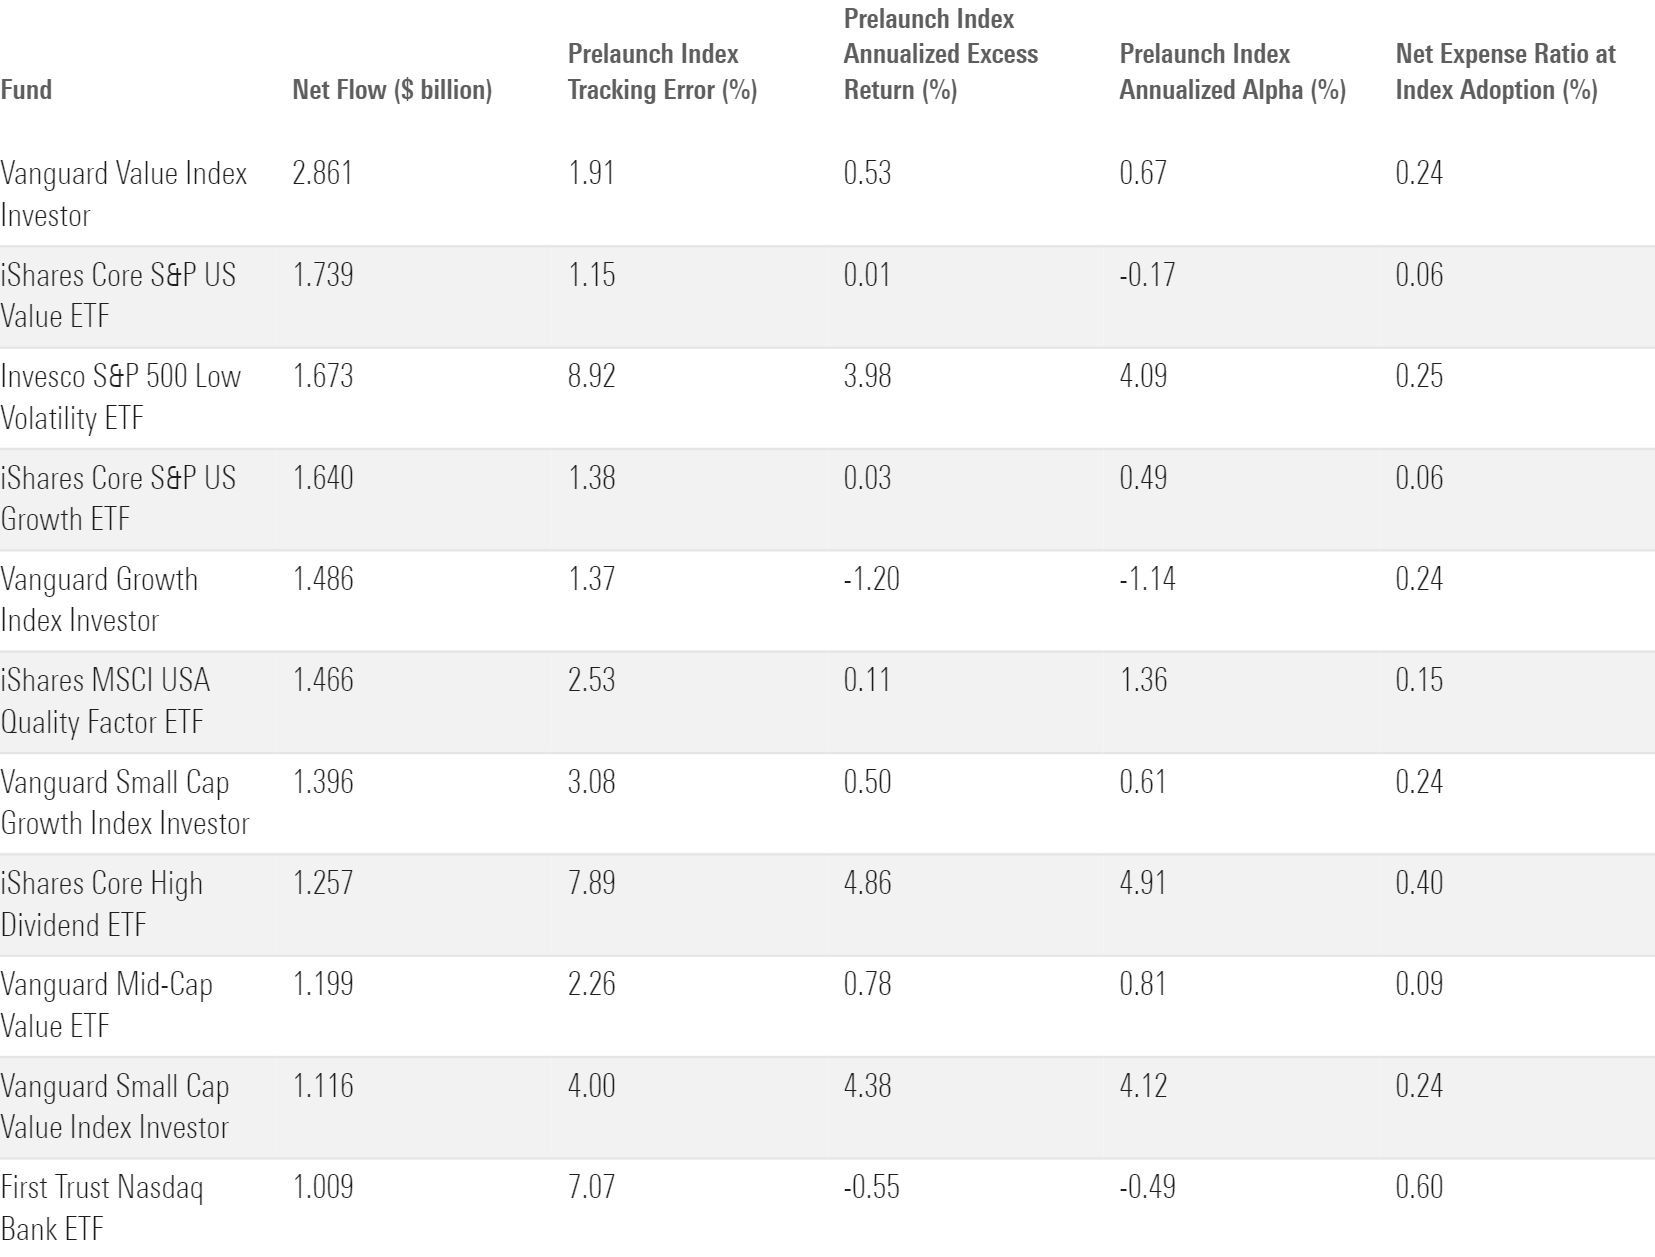
The table below lists the index funds that proved most successful over the first 12 months after adopting an index. Most were offered by two of the biggest index fund providers in the United States: iShares and Vanguard. Most track indexes that represent the opportunity set in their given category, hence the low tracking errors, annualized excess returns, and annualized alphas. And perhaps more importantly, they were cheap. The average fee levied by these 11 funds landed around 0.23% when they adopted their indexes.
Broad and Cheap Index Funds Attracted the Most New Money
The author or authors do not own shares in any securities mentioned in this article. Find out about Morningstar’s editorial policies.
/cloudfront-us-east-1.images.arcpublishing.com/morningstar/KIQMCCUZ2RGWZKSCKM2Z4ZULFU.png)
/d10o6nnig0wrdw.cloudfront.net/09-27-2024/t_c482f9886c534a7a8c406623fe438463_name_file_960x540_1600_v4_.jpg)
/cloudfront-us-east-1.images.arcpublishing.com/morningstar/RSZNI74R6FG7FDSWBUF6EWKDE4.png)
:quality(80)/s3.amazonaws.com/arc-authors/morningstar/78665e5a-2da4-4dff-bdfd-3d8248d5ae4d.jpg)