
ETF Investors Bought in May and Kept Buying in June
Bond ETFs are on track for record inflows in 2020.
/s3.amazonaws.com/arc-authors/morningstar/a90ba90e-1da2-48a4-98bf-a476620dbff0.jpg)
Global markets regained more ground in June. At month-end, the Morningstar Global Markets Index--a broad gauge of global stock markets--had rebounded 38% from its recent low and sat just 9% below its mid-February peak. The index declined 7% through the first half of the year. The bond market has stabilized since the U.S. Federal Reserve’s late-March intervention. After dropping into negative territory earlier in the year, the Morningstar US Core Bond Index was up just over 6% for the year to date by the end of June.
Here, I will take a closer look at how the major asset classes performed last month, where investors were putting their money, and which segments of the market look cheap and dear--all through the lens of exchange-traded funds.
Changes in Leadership
Exhibit 1 features June performance figures for a sampling of Morningstar Medalist ETFs representing most major asset classes. Investors in a blended global market portfolio gained just over 2% during the month. Stock markets were up across the board, though there were some notable changes in their main engines.
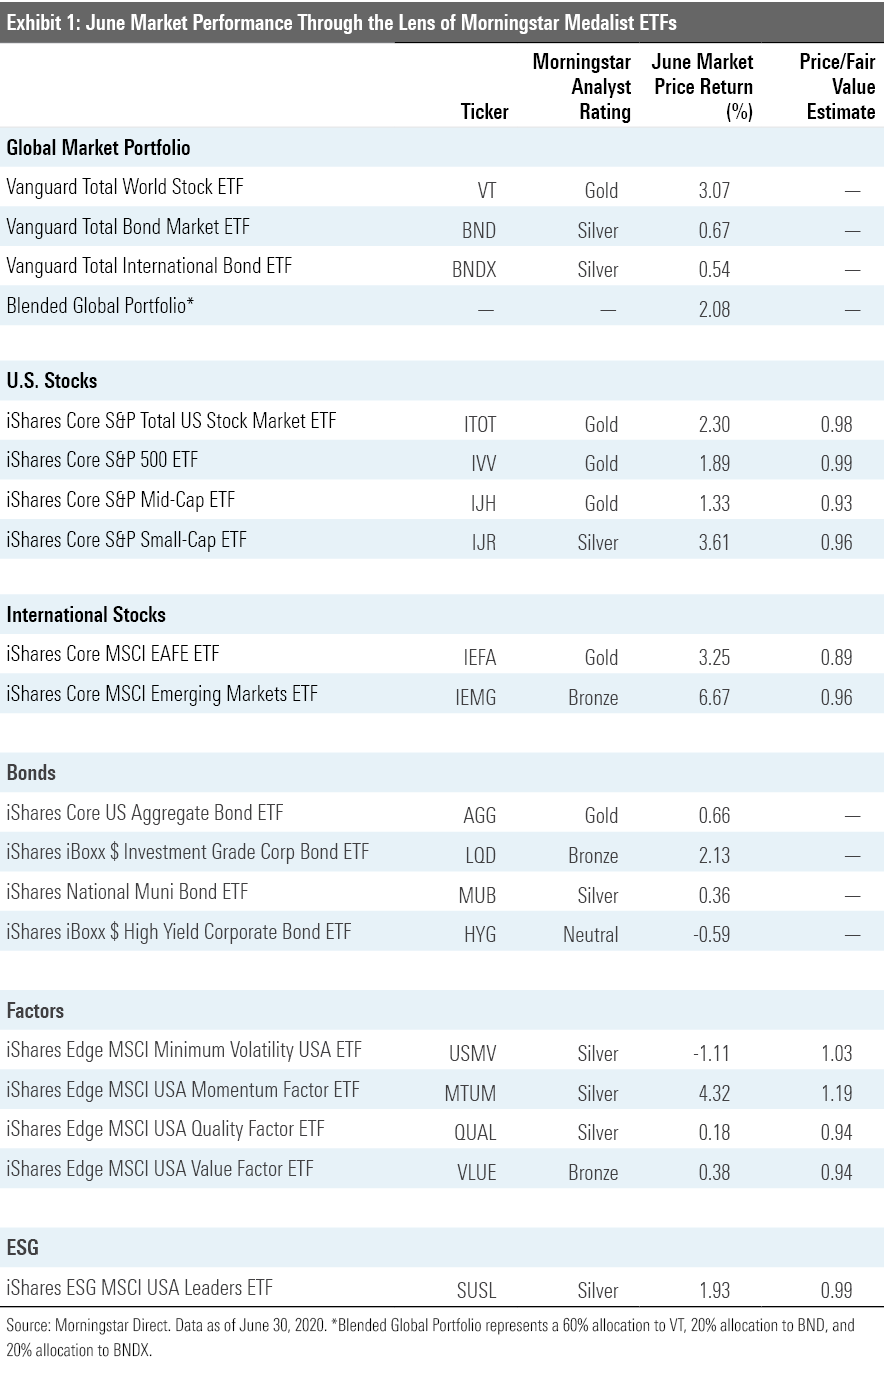
Emerging-markets stocks outperformed both developed international and U.S. stocks. But though both iShares Core MSCI EAFE ETF IEFA and iShares Core MSCI Emerging Markets ETF IEMG beat iShares Core S&P U.S. Total Stock Market ETF ITOT in June, they have lost a lot of ground to U.S. stocks in recent years. Over the five years through June, ITOT outgained both IEFA and IEMG by about 7.7 percentage points annually.
The other turnaround of note was U.S. small caps, which outperformed both their large- and mid-cap counterparts. Though like foreign stocks, small caps are playing from behind. Over the past five years, iShares Core S&P Small Cap ETF IJR has lagged iShares Core S&P Mid Cap ETF IJH and iShares Core S&P 500 ETF IVV, by 5.7 and 0.7 percentage points a year, respectively.
The performance spread across the diagonal of the Morningstar Style Box narrowed a bit in June. The iShares S&P 500 Growth ETF IVW, which falls in the large-growth Morningstar Category, outperformed iShares S&P Small-Cap 600 Value ETF IJS, which sits in small value, by 0.5%. For the year to date through June, IVW has outperformed IJS by 32%. IJS has fallen more than 24% in 2020--pouring salt on the wounds of long-suffering value investors.
Most sectors of the bond market had recovered first-quarter losses by the end of June. The most notable exception was the high-yield market, which remained under pressure in June. Credit markets--and bond ETFs--snapped back into order following the Federal Reserve's late-March intervention. In May, the Fed began purchasing corporate-bond ETFs as part of its previously announced plan to backstop the bond market with its Secondary Market Corporate Credit Facility. As of June 16, it had purchased shares of 16 different corporate-bond ETFs with a total market value of $6.8 billion.
Strategic-beta ETFs representing a variety of individual factors had a mixed showing versus the broader U.S. stock market. Value-oriented funds continue to struggle on a relative basis. Meanwhile, momentum stocks have been resilient. Through the first half of the year, iShares Edge MSCI USA Value Factor ETF VLUE has fallen 18%, while iShares Edge MSCI USA Momentum Factor ETF MTUM has gained 5%--outperforming the broader market. At the end of June, VLUE was trading at a 6% discount to its Morningstar fair value estimate, while MTUM was priced 19% higher than our analysts' assessment of its intrinsic worth.
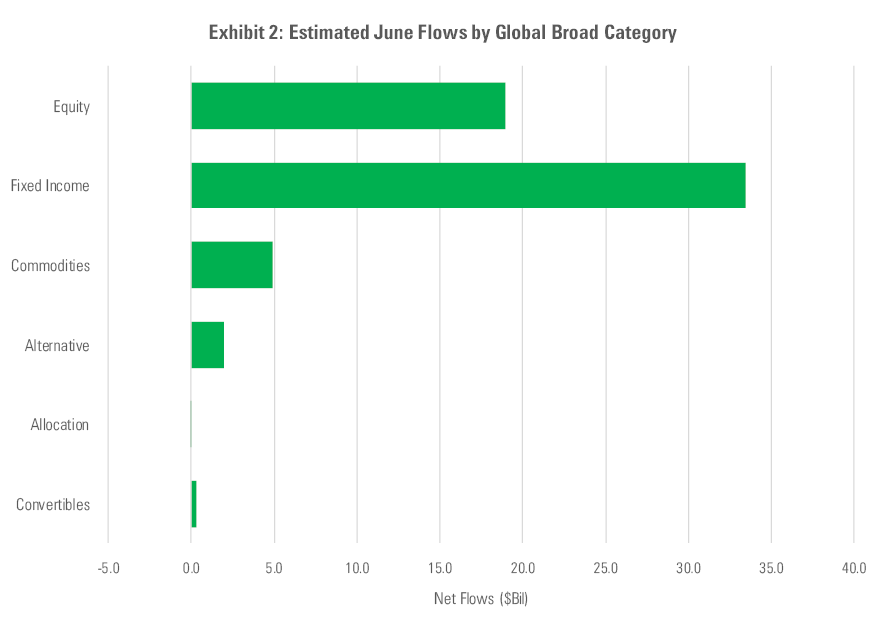
Booming Bond Flows ETF flows again favored bond funds in June. Fixed-income ETFs took in $33.5 billion in net new flows--a monthly record. Over the past three months, estimated net flows into fixed-income ETFs amounted to just over $84.5 billion. This is the largest three-month net flow into bond ETFs on record by a wide margin, setting bond ETFs on pace to have a record year of inflows.
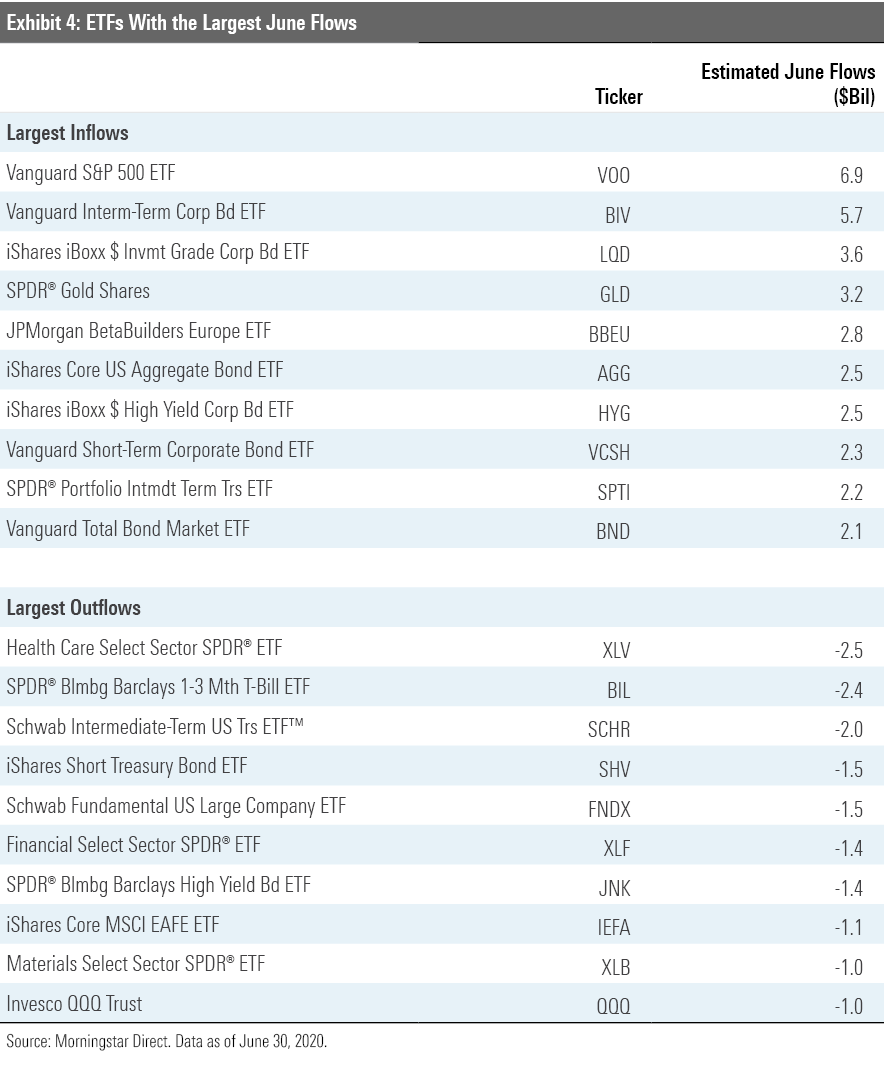
Notable among the asset-gatherers in the bond space were Bronze-rated iShares iBoxx $ Investment Grade Corporate Bond ETF LQD and Silver-rated Vanguard Short-Term Corporate Bond ETF VCSH. Both funds featured prominently on the Fed's shopping list, ranking first and second by market value, respectively, on the roster of its ETF acquisitions.
Physical gold ETFs continued to gain assets from safe-haven seekers. SPDR Gold Shares GLD saw another $3.2 billion in net new inflows in May. This marks the seventh-straight month that GLD has seen net new inflows. In sum, investors have poured nearly $16.2 billion in new money into GLD over that seven-month stretch. With $67 billion in assets, GLD is as big as it has been since the last gold rush among investors during the years following the global financial crisis.
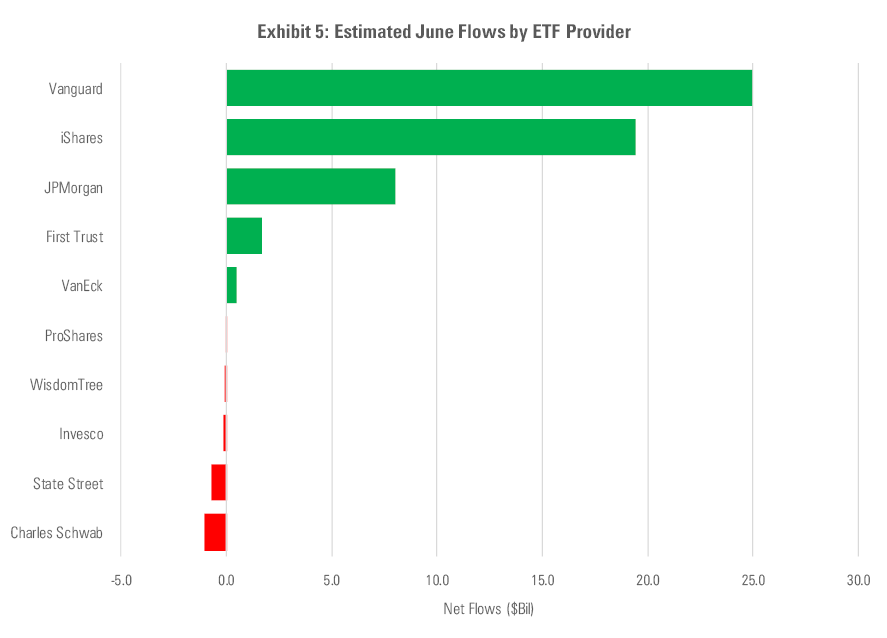
Looking at flows at an ETF issuer level can help tune out some of the noisiness associated with short-term ETF flows and yield some signals. From this perspective (see Exhibit 5), it appears that the steady-Eddie clientele served by firms like Vanguard remain steady as ever. Schwab's ETF lineup experienced its third consecutive month of outflows. This new trend bucks a long record of steady net inflows into the firm's lineup of ETFs, which went unbroken from their 2009 inception through April of this year. Meanwhile, market volatility continued to be a boon for firms like State Street and ProShares, whose ranges cater to a crowd that tends to use ETFs in a more tactical manner.
What's Cheap and What's Dear? The Morningstar fair value estimate for ETFs rolls up our equity analysts' fair value estimates for individual stocks and our quantitative fair value estimates for those stocks not covered by Morningstar analysts into an aggregate fair value estimate for stock ETF portfolios. Dividing this value by the ETFs' market prices yields a price/fair value ratio. This ratio can point to potential bargains and areas of the market where valuations are stretched.
Exhibit 6 features the 10 ETFs that were trading at the largest discounts and premiums to their fair value estimates as of the end of June. Five of the funds trading at the largest discounts belong to the equity energy category. Pain has been pervasive in the energy sector this year as demand has declined and supply has continued to flood the market. As producers ran out of places to store their output, prices collapsed--as did the share prices of firms operating in the oil- and gas-service industry.
But the market is a discounting mechanism, and many investors are wagering that the worst has passed. While oil prices rallied in June, energy stocks’ recent gains stalled. Energy Select Sector SPDR ETF XLE, which holds the energy names in the S&P 500, fell 1.1%. While the sector has come back from the brink, many energy stocks are still trading at steep discounts.
Technology stocks have been on a tear this year, so it is no surprise to see a number of tech-focused funds among the ranks of the most overvalued ETFs. Notable among them are Global X Cloud Computing ETF CLOU and WisdomTree Cloud Computing ETF WCLD. Both funds were more than 30% overvalued as of the end of June. Investors’ enthusiasm for these stocks has grown amid a worldwide lockdown that’s forced many to work, shop, and live online.
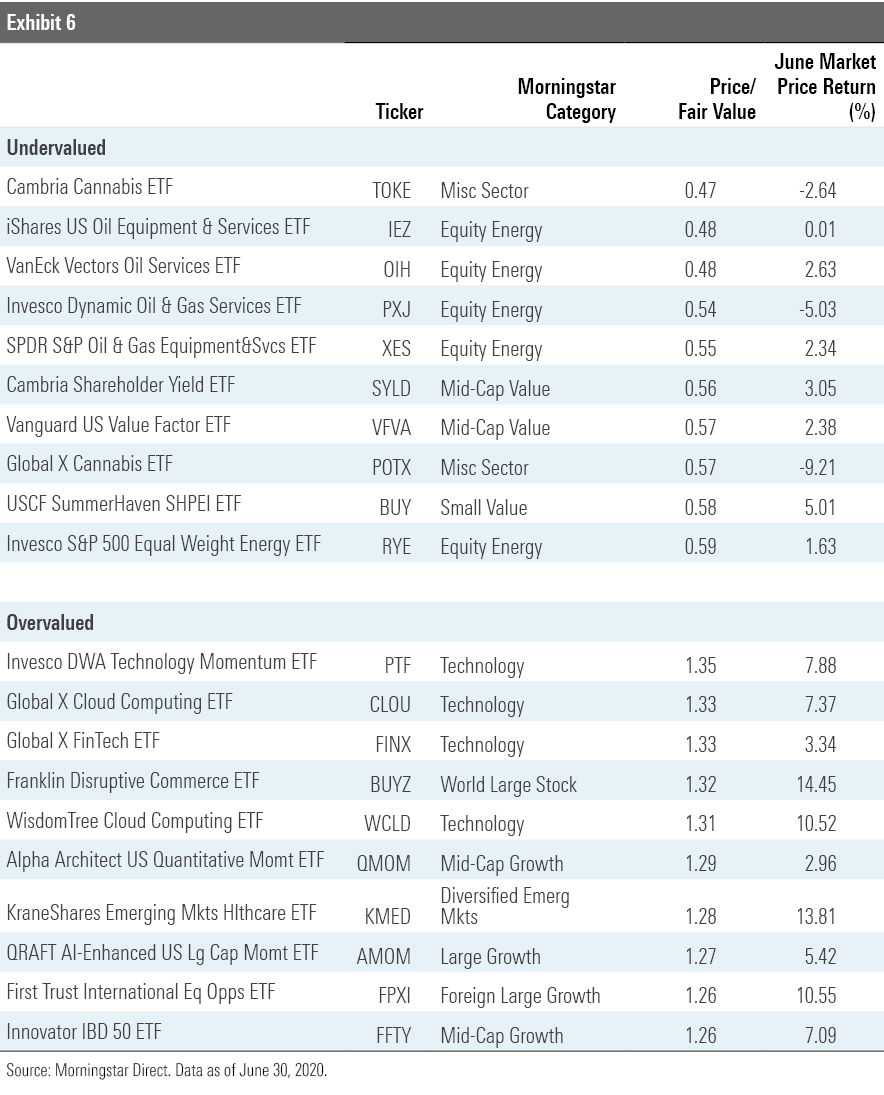
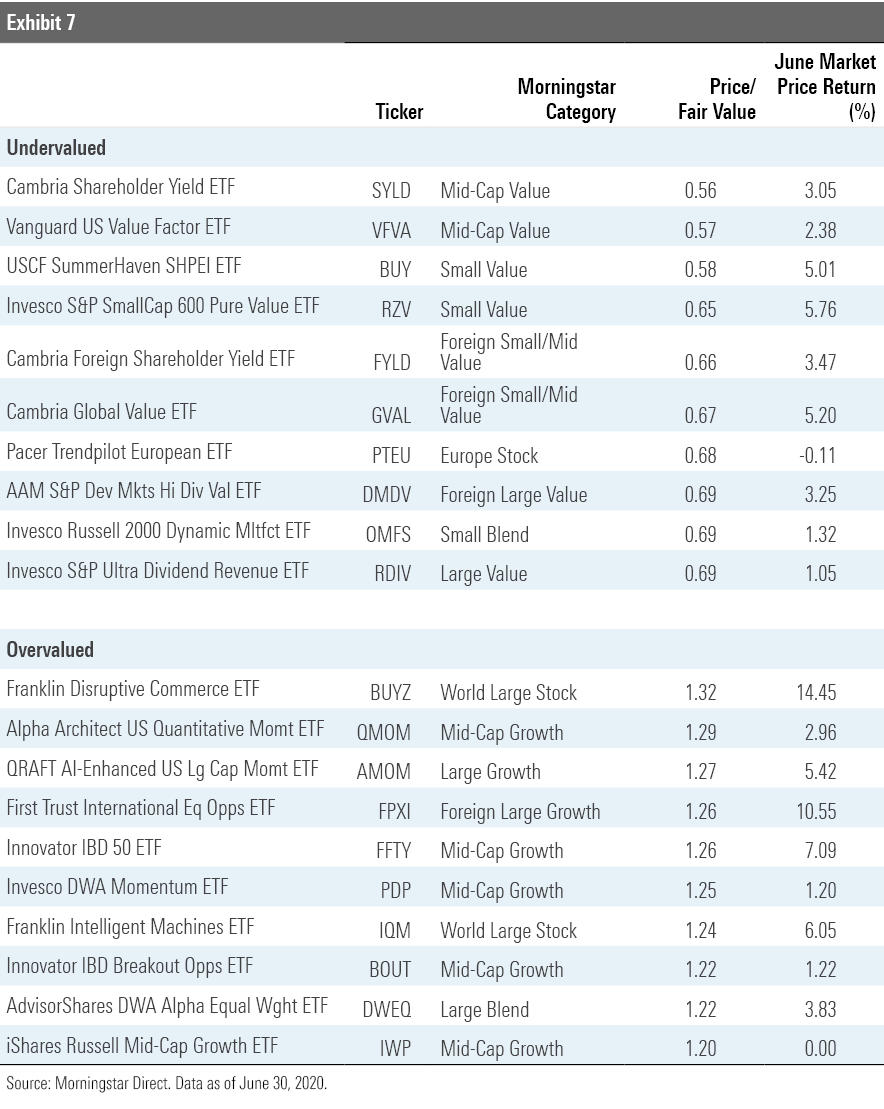
Exhibit 7 features the 10 broad-based (those ETFs belonging to one of the mainline Morningstar Style Box or other broader geographic categories) that were trading at the largest discounts and premiums to their fair value estimates as of month end. The common thread among the most undervalued funds is an orientation toward smaller, cheaper stocks. Some of them deliberately lean into value by virtue of selecting and weighting stocks based on their relative cheapness. This is the case for funds like Vanguard U.S. Value Factor ETF VFVA and Invesco S&P SmallCap 600 Pure Value ETF RZV. Others back into a deep-value orientation by selecting stocks based on their dividend and/or shareholder yields. Cambria Shareholder Yield ETF SYLD is an example. The fund selects its 100-stock portfolio from the highest-yielding 20% of its selection universe based on firms' dividend and net share-buyback yields.
The most overvalued broad-based ETFs include a number of funds with a momentum focus. Alpha Architect U.S. Quantitative Momentum ETF QMOM and QRAFT AI-Enhanced U.S. Large Cap Momentum ETF AMOM both spin highly concentrated, high-octane momentum portfolios by design. Folding in names that are priced at premium multiples is embedded in these funds’ DNA.
Disclosure: Morningstar, Inc. licenses indexes to financial institutions as the tracking indexes for investable products, such as exchange-traded funds, sponsored by the financial institution. The license fee for such use is paid by the sponsoring financial institution based mainly on the total assets of the investable product. Please click here for a list of investable products that track or have tracked a Morningstar index. Neither Morningstar, Inc. nor its investment management division markets, sells, or makes any representations regarding the advisability of investing in any investable product that tracks a Morningstar index.
/cloudfront-us-east-1.images.arcpublishing.com/morningstar/NPR5K52H6ZFOBAXCTPCEOIQTM4.png)
/cloudfront-us-east-1.images.arcpublishing.com/morningstar/OMVK3XQEVFDRHGPHSQPIBDENQE.jpg)
/d10o6nnig0wrdw.cloudfront.net/09-24-2024/t_c34615412a994d3494385dd68d74e4aa_name_file_960x540_1600_v4_.jpg)
:quality(80)/s3.amazonaws.com/arc-authors/morningstar/a90ba90e-1da2-48a4-98bf-a476620dbff0.jpg)