ETF Flows Continue Record Pace in August
US ETFs gathered $75 billion behind burgeoning bond flows.

Key Takeaways
- The Morningstar Global Markets Index, a broad benchmark of global equities, recovered from an early scare and gained 2.4% in August.
- Weak economic data affirmed investors’ belief that interest-rate cuts are imminent and powered a 1.4% gain for the Morningstar US Core Bond Index.
- The taxable-bond group added to its stellar year of inflows with a $31 billion August haul.
- Long government funds collected north of $7 billion as investors embraced interest-rate risk.
- US stock funds pulled in roughly $31 billion as well; international stock fund flows were flat.
- JPMorgan Equity Premium Income ETF JEPI saw modest outflows, ending a legendary run of inflows that spanned four-plus years and totaled $30 billion.
Revised Rate Outlook Boosts Bonds
Exhibit 1 shows the August 2024 returns for a sample of analyst-rated ETFs that cover major sections of the stock and bond markets. A blended global portfolio gained 1.8% last month, pushing its return north of 10% from January through August 2024.
August Market Performance through the Lens of Analyst-Rated ETFs
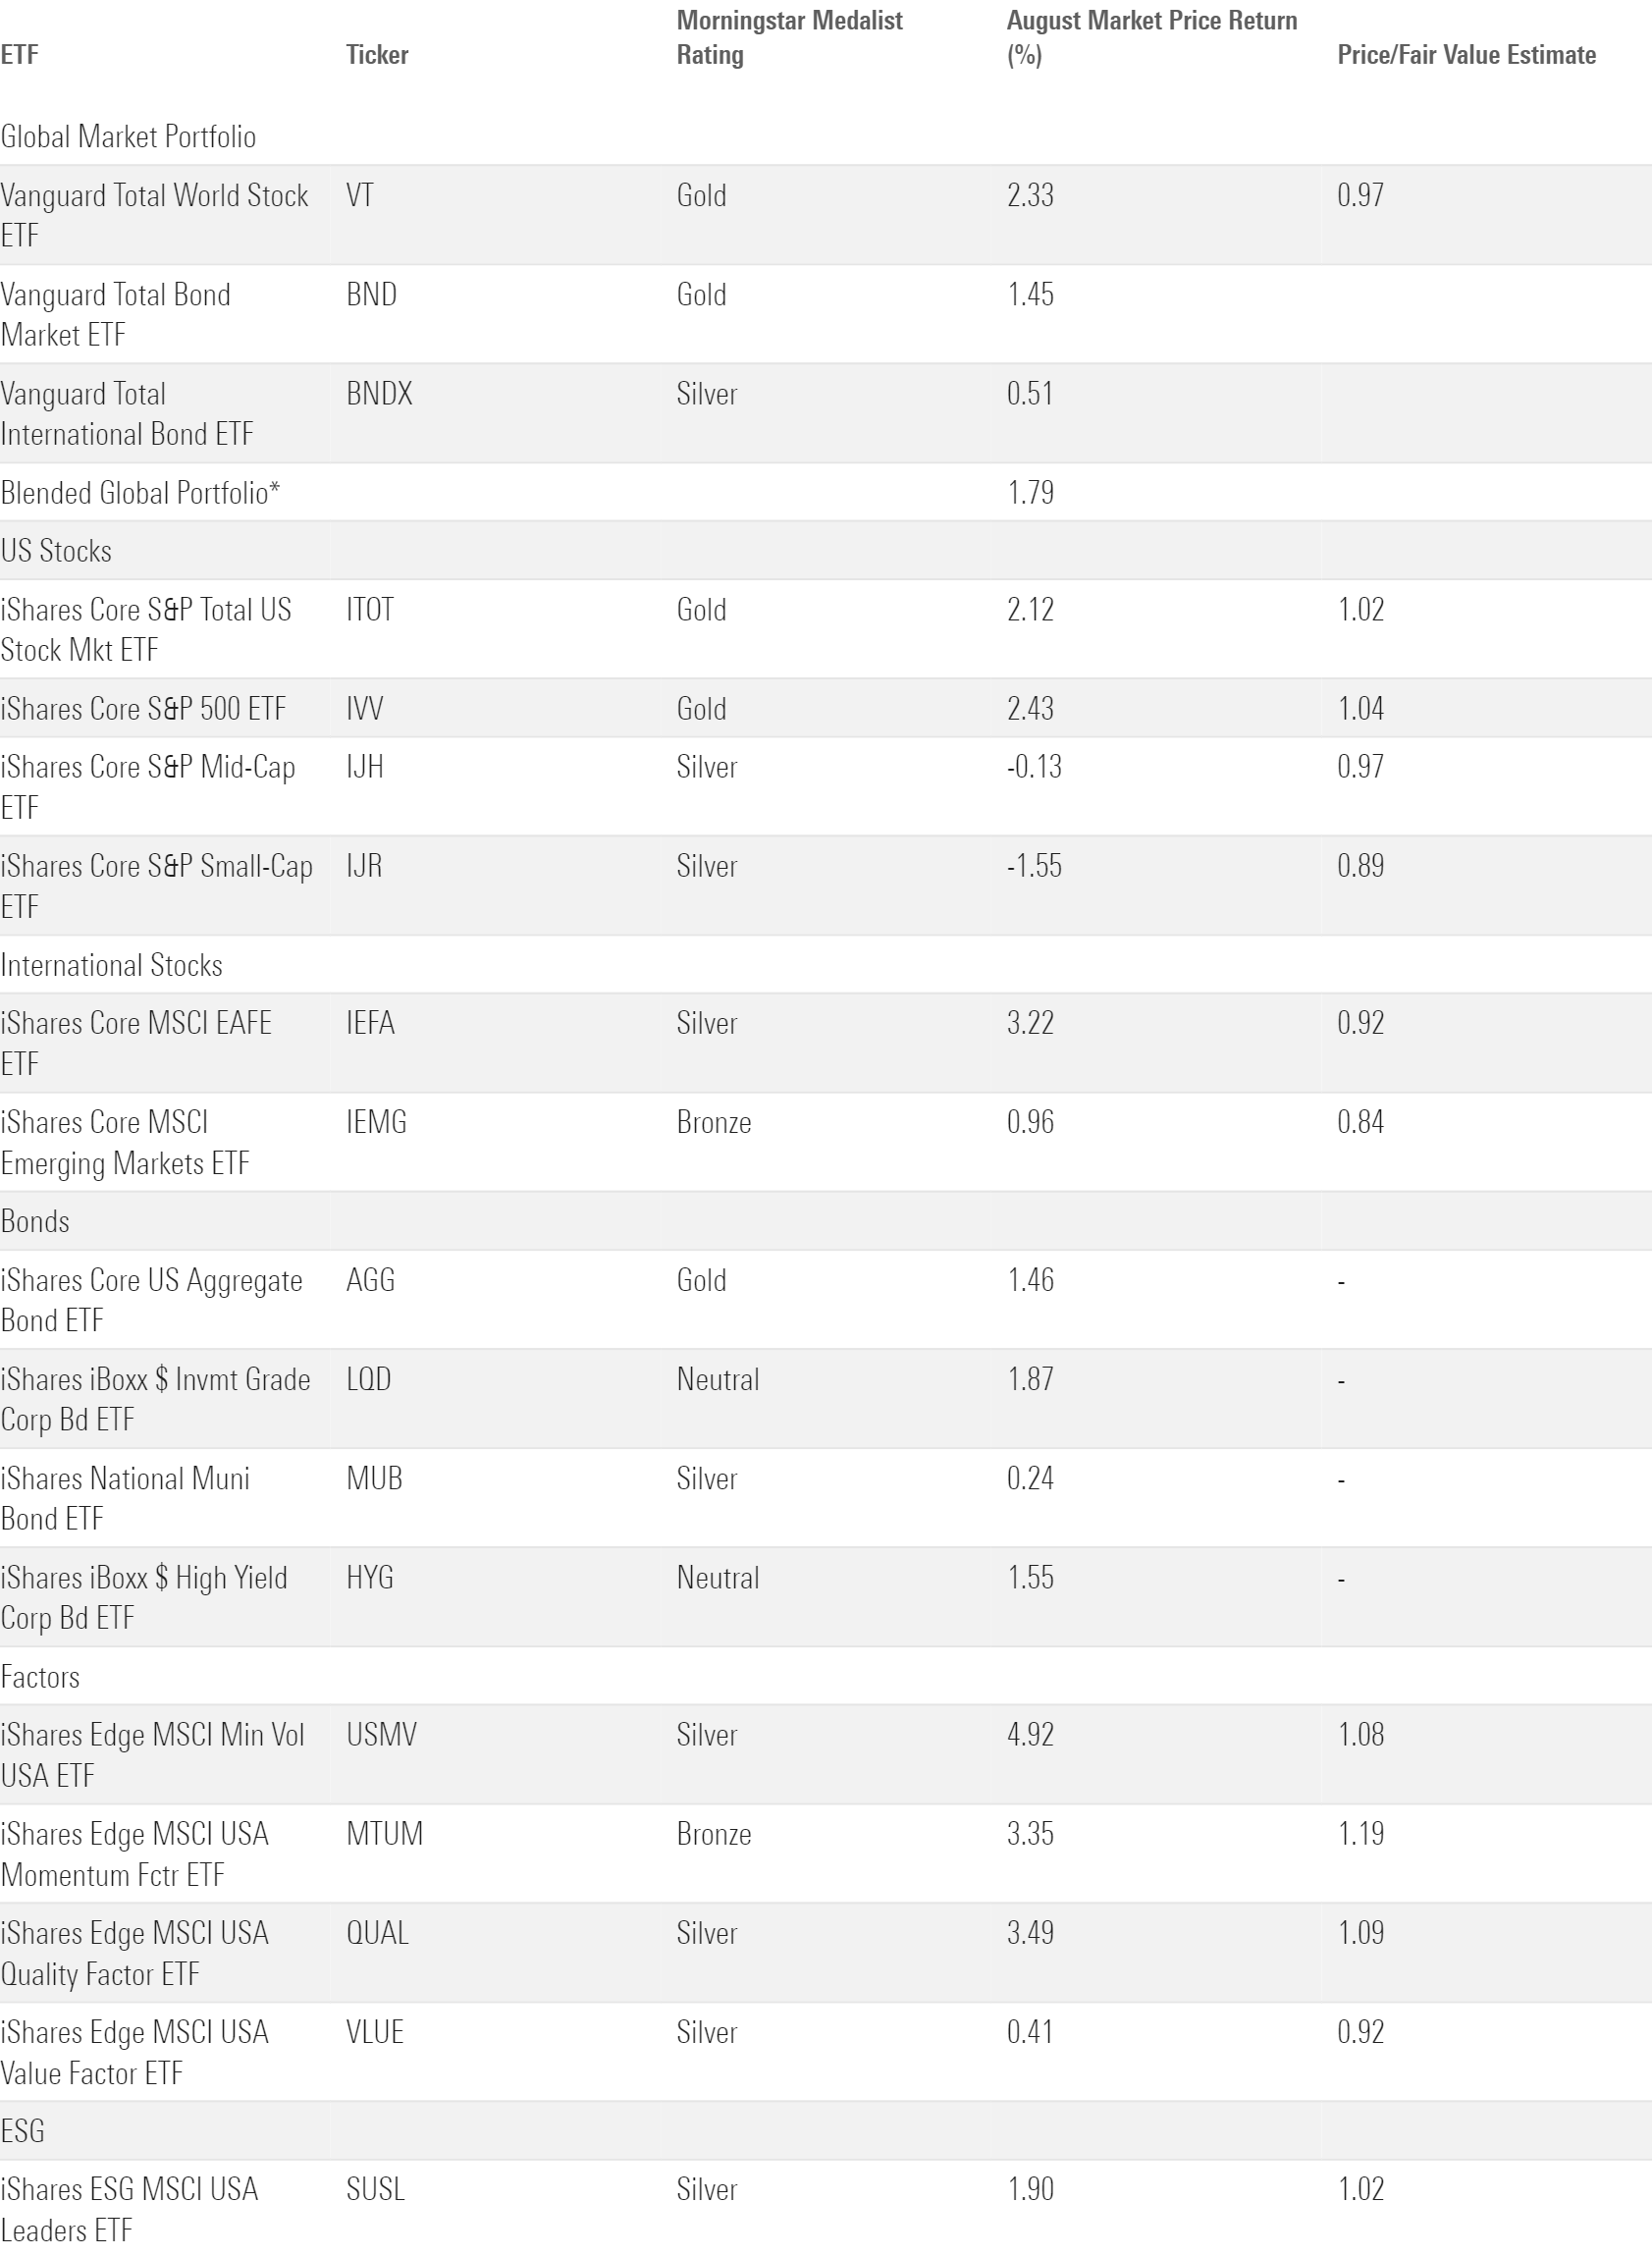
The blended portfolio’s solid results didn’t come easy. Early in August, a weak jobs report and a surprise Japanese interest-rate hike ignited a swift global stock selloff and weighed on bond yields. Global stocks regained their footing almost as quickly as they lost it. Still, the selloff reflected cracks in the US economy that the market’s quick rebound could not conceal. Markets treated the economic news as surefire evidence that the Federal Reserve would decrease interest rates in September. According to CME’s FedWatch tool, 63% of traders expected rates to decrease 25 basis points, and the rest expected a 50-basis-point drop on Aug. 30, 2024.
The revised rate expectations were a tailwind for bonds. Most bond ETFs finished August 1%-2% higher. The initial panic scattered some Morningstar Categories early in the month, though. IShares 20+ Year Treasury Bond ETF TLT climbed about 4.6% over the first three trading days of August. Effectively a distilled bet on interest rates, this long-term portfolio soared when the outlook for their trajectory improved overnight.
Bond funds built around corporate credit instead of rates went in the other direction. They behave more like stocks; bad news for US companies is bad news for the bonds they issue. Indeed, SPDR Bloomberg High Yield Bond ETF JNK slid more than 1% in the first three trading days of August. Mean reversion kicked in shortly thereafter. The high-yield portfolio clawed its way back and gained 1.6% in August, not far behind the 2.2% return that TLT finished with after it couldn’t maintain its hot start to the month.
Stocks Get on Track After Early Stumble
US stocks showed their mettle in August. Vanguard Total Stock Market ETF VTI tumbled 6.4% over the first three trading days only to finish the month with a 2.1% gain.
Large-cap stocks spearheaded the turnaround, but it was a far more balanced effort than the concentrated rallies of late. IShares Core S&P 500 ETF IVV and Invesco S&P 500 Equal Weight ETF RSP advanced between 2.4% and 2.5% apiece last month. Traditionally defensive companies navigated the market’s undulations best. Walmart WMT, Altria MO, and Coca-Cola KO all notched double-digit returns, helping Consumer Staples Select Sector SPDR ETF XLP to a 6% gain that led the SPDR sector suite. Meanwhile, the market darlings that set the pace all year slid to the back burner. Roundhill Magnificent Seven ETF MAGS—an equal-weighted portfolio of the tech septet—lost 0.7% on the month.
August marked the second straight month in which value stocks outpaced their growthier peers. Vanguard Value ETF VTV beat Vanguard Growth ETF VUG by about 7 percentage points over the past two months after trailing it by nearly 12 percentage points in the first half.
Investors may doubt that this trend reversal signals a longer-term market rotation, but one strategy has no such reservations: iShares MSCI USA Momentum ETF MTUM. The fund cut its technology exposure to 21% from 35% when it rebalanced at the start of September, filling the vacuum with cheaper consumer staples, financials, and real estate stocks. Pivoting into cheaper sectors could stick this fund well behind its peers in the large-growth category if growth stocks return to dominance. But it’s been a bad idea to bet against MTUM of late: Its 35.1% gain over the past 12 months trumped both the Morningstar US Market Index’s 26.5% and the Russell 1000 Growth Index’s 30.8%.
Vanguard Total International Stock VXUS climbed 2.4% in another positive month for foreign stocks. Hearty returns from several developed European markets paved the way. Morningstar indexes that track the Germany, Switzerland, France, and UK stock markets gained between 3% and 5% apiece in August. Elsewhere, iShares MSCI Japan ETF EWJ closed the month with a 1.4% gain, a feat that seemed unthinkable when it was down 11.2% after the first three trading days in August.
ETF Flows Chart Record Pace
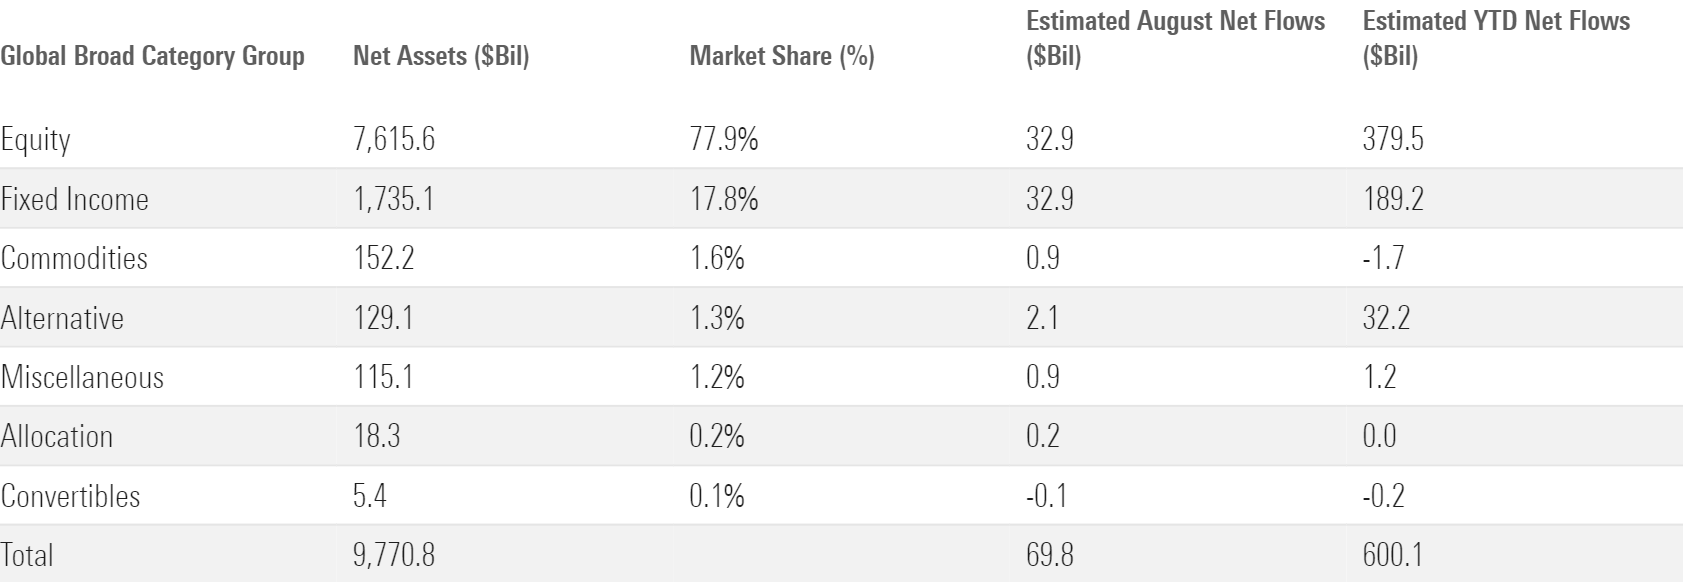
Investors poured $70 billion into US ETFs in August. That pushed 2024 inflows past $600 billion and paced ETFs to finish the calendar year with $900 billion of inflows—nearly the same figure they recorded in 2021 and an annual record that is now in jeopardy.
August Flows across Morningstar Broad Category Groups
Active ETFs: What Investors Need to Know Now
Stock ETF Flows
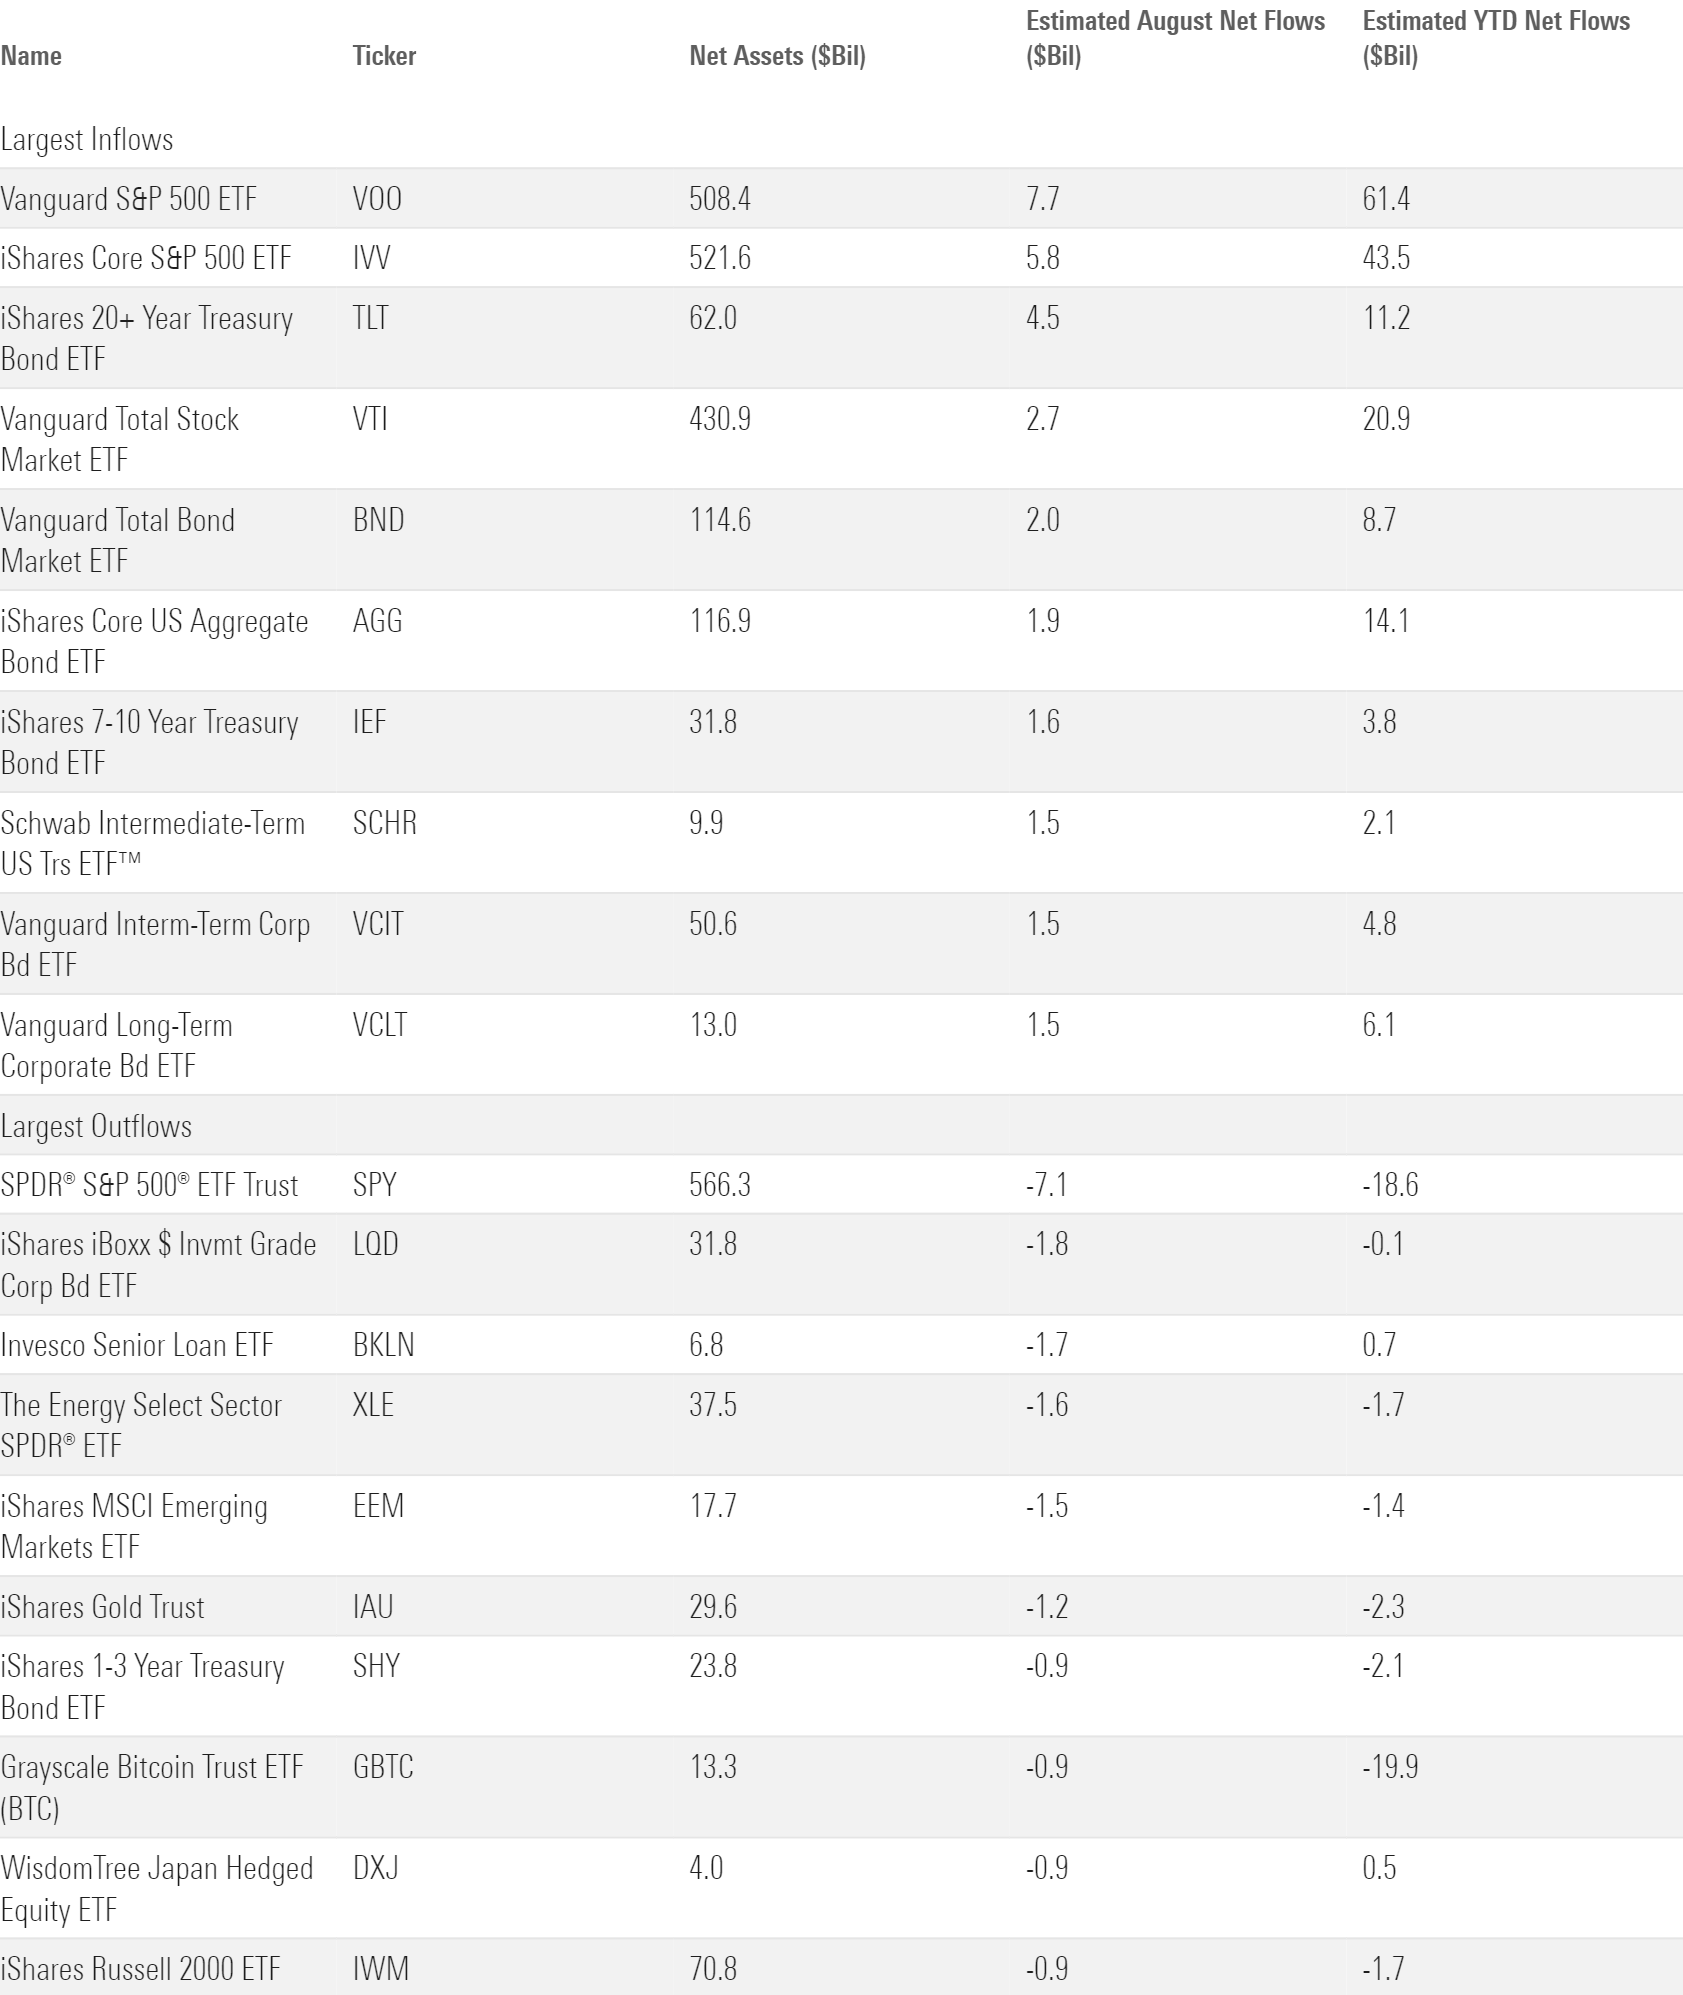
US stock funds collected about $31 billion in August, a shade below their monthly average inflow this year. The bulk of that money streamed into the large-blend category, as usual. Vanguard S&P 500 ETF VOO cushioned the annual inflow record it set in July with a fresh $8 billion haul in August. Chief rival IVV collected $6 billion and has now accumulated $43 billion of inflows on the year. The fund will probably shatter the previous annual inflow record of $51 billion, and it still trails VOO by $18 billion on the year.
The large-growth and large-value categories each pulled in $4.7 billion in August. Large value had a small edge, though, making last month the first this year that it collected more money than large growth. Changing dynamics between strategic-beta fund flows helped push large-value funds ahead. Dividend funds in that category reeled in $1.6 billion in August after losing more than $2 billion on the year beforehand. Meanwhile, momentum funds that sit in the large-growth segment shed roughly $200 million after gathering more than $2 billion in the seven months prior. Rotating from high-flying momentum into sturdy dividend portfolios may be one way investors responded to the perceived stock market rotation.
Morningstar Categories with the Largest August Flows
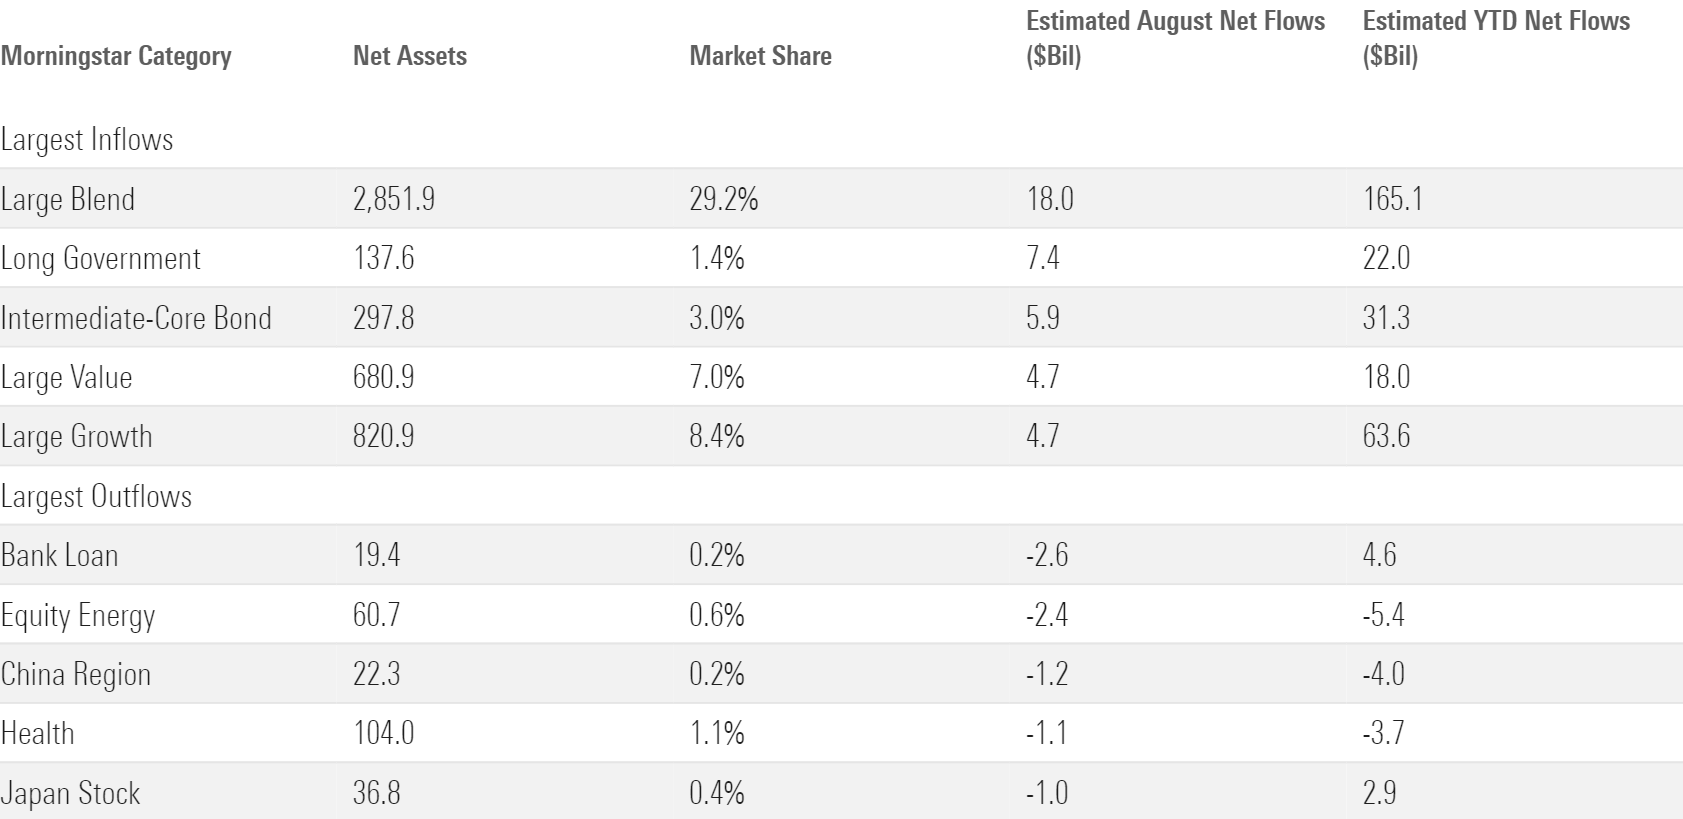
The international stock fund cohort was one of the few cold spots in August. Foreign large-blend funds reeled in $3.6 billion, while the rest of the group collectively bled $4 billion. Categories that target Asia-Pacific markets endured the worst of it. The China Region category shed $1.2 billion last month and $4 billion for the year to date, the result of lackluster returns that sit well behind most global markets in 2024. Japan stock funds lost about $1 billion as well, an understandable result given their shock early in the month.
Nontraditional stock funds cleared just over $1 billion of inflows last month. The headline from this group—one of the market’s most consistent of late—was that JPMorgan Equity Premium Income ETF JEPI saw outflows in August. The $35 billion freight train’s first monthly outflows is a symbolic conclusion to a legendary run of inflows dating back to its inception in May 2020. JEPI raked in more than $30 billion over that span, spearheading the rise of the covered-call ETF phenomenon along the way. Fortunately for J.P. Morgan, the Steve Young to JEPI’s Joe Montana has already emerged: JPMorgan Nasdaq Equity Premium Income JEPQ has raked in more than $7 billion on the year, including roughly $600 million in August.
Bond ETF Flows
Taxable-bond funds raked in $31 billion in August, the same total as US stock funds but more than triple the growth when adjusting for the size of the cohorts. The taxable-bond category group posted a 12.8% organic growth rate since the start of 2024, well ahead of US stock (6.7%) or international stock (4.7%) funds. In other words, bond funds are carrying a huge load, a key reason ETFs are surging toward record inflows.
Different bond categories have taken turns leading the pack this year. It was long government’s turn in August. TLT led all bond ETFs with nearly $5 billion of inflows on the month. Investors use this fund as a chip to bet on interest rates, a use case that served it well when the rate outlook improved early in the month. Caution is a virtue when it comes to this fund, though. It raked in $45 billion from January 2022 through June 2024 as investors bought it to wager on falling interest rates. But almost all were too early; the fund sank 33.2% over that span. It seems far more certain that the Fed will reduce rates today than any time over the past 2.5 years. But that begs the question: is the upside to this fund already baked into its price?
ETFs with the Largest August Flows
The rise of active ETFs has benefited the taxable-bond cohort more than any other. Actively managed taxable-bond funds have reeled in $56 billion on the year. That represents about 32% of net flows into all active ETFs—not bad for a category group that represents about 16% of the market.
Intermediate core-plus, ultrashort, and multisector are a few categories where active ETF inflows have outpaced their indexed peers. Long the domain of mutual funds, ETF growth in those areas has lifted the overall group to new heights. Healthy flows into the likes of Fidelity Total Bond ETF FBND, JPMorgan Ultra-Short Income ETF JPST, and BlackRock Flexible Income ETF BINC helped make August the latest chapter in a strong year for active bond ETFs.
State of Affairs
Vanguard raked in about $26 billion last month, leading all ETF providers and extending Vanguard’s lead on iShares in the 2024 flows race. Even a $30 billion deficit is surmountable for iShares, though. The market’s largest ETF shop proved as much when it reeled in record inflows in June 2024.
August Flows for the 10 Largest ETF Providers
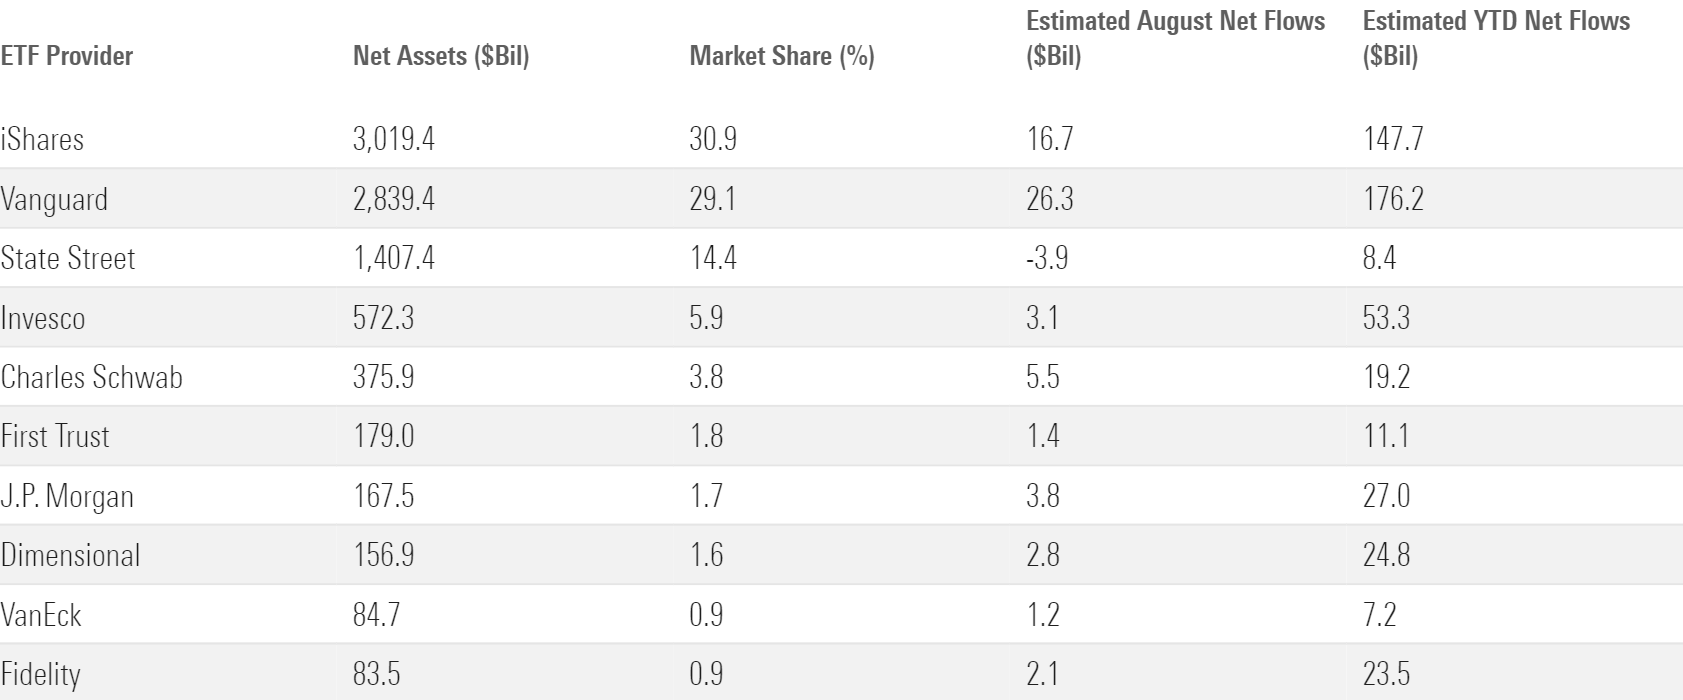
Watching the market’s two largest ETF providers race toward annual records highlights just how wide the gap has grown between them and State Street, long considered the third of the ETF (and index investing) industry’s “Big Three.” Some have questioned State Street’s standing in the mighty (yet practically inconsequential) triumvirate. After all, its $1.3 trillion treasure chest is closer in size to fourth-place Invesco than either of the two leaders. State Street represented 14.5% of the ETF market as of August 2024. It commanded 21.8% of it 10 years earlier.
Recent flows have been shaky. State Street collected $11 billion for the year to date through August, on pace for its weakest year since 2018. Much of the blame falls on bell cow SPDR S&P 500 Trust ETF SPY. The world’s most notorious ETF represents more than 40% of its parent firm’s assets yet shed $16 billion over the past eight months. That result is bad but not wholly surprising; SPY’s status as a chess piece for stock liquidity among short-term traders leaves it exposed to whiplash flows. Tepid investor interest in sector ETFs and a smaller footprint in the growing bond ETF space have kept a lid on State Street as well.
How can State Street level up? That question demands an answer far too nuanced for this report. But until State Street finds the answer, the firm will find itself looking up at Vanguard and iShares.
Small Value Stands Out
The fair value estimate for ETFs rolls up our equity analysts’ fair value estimates for individual stocks and our quantitative fair value estimates for stocks not covered by Morningstar analysts into an aggregate fair value estimate for stock ETF portfolios. Dividing an ETF’s market price by this value yields its price/fair value ratio. This ratio can point to potential bargains and areas of the market where valuations are stretched.
The 10 Most Under- and Overvalued Analyst-Rated ETFs
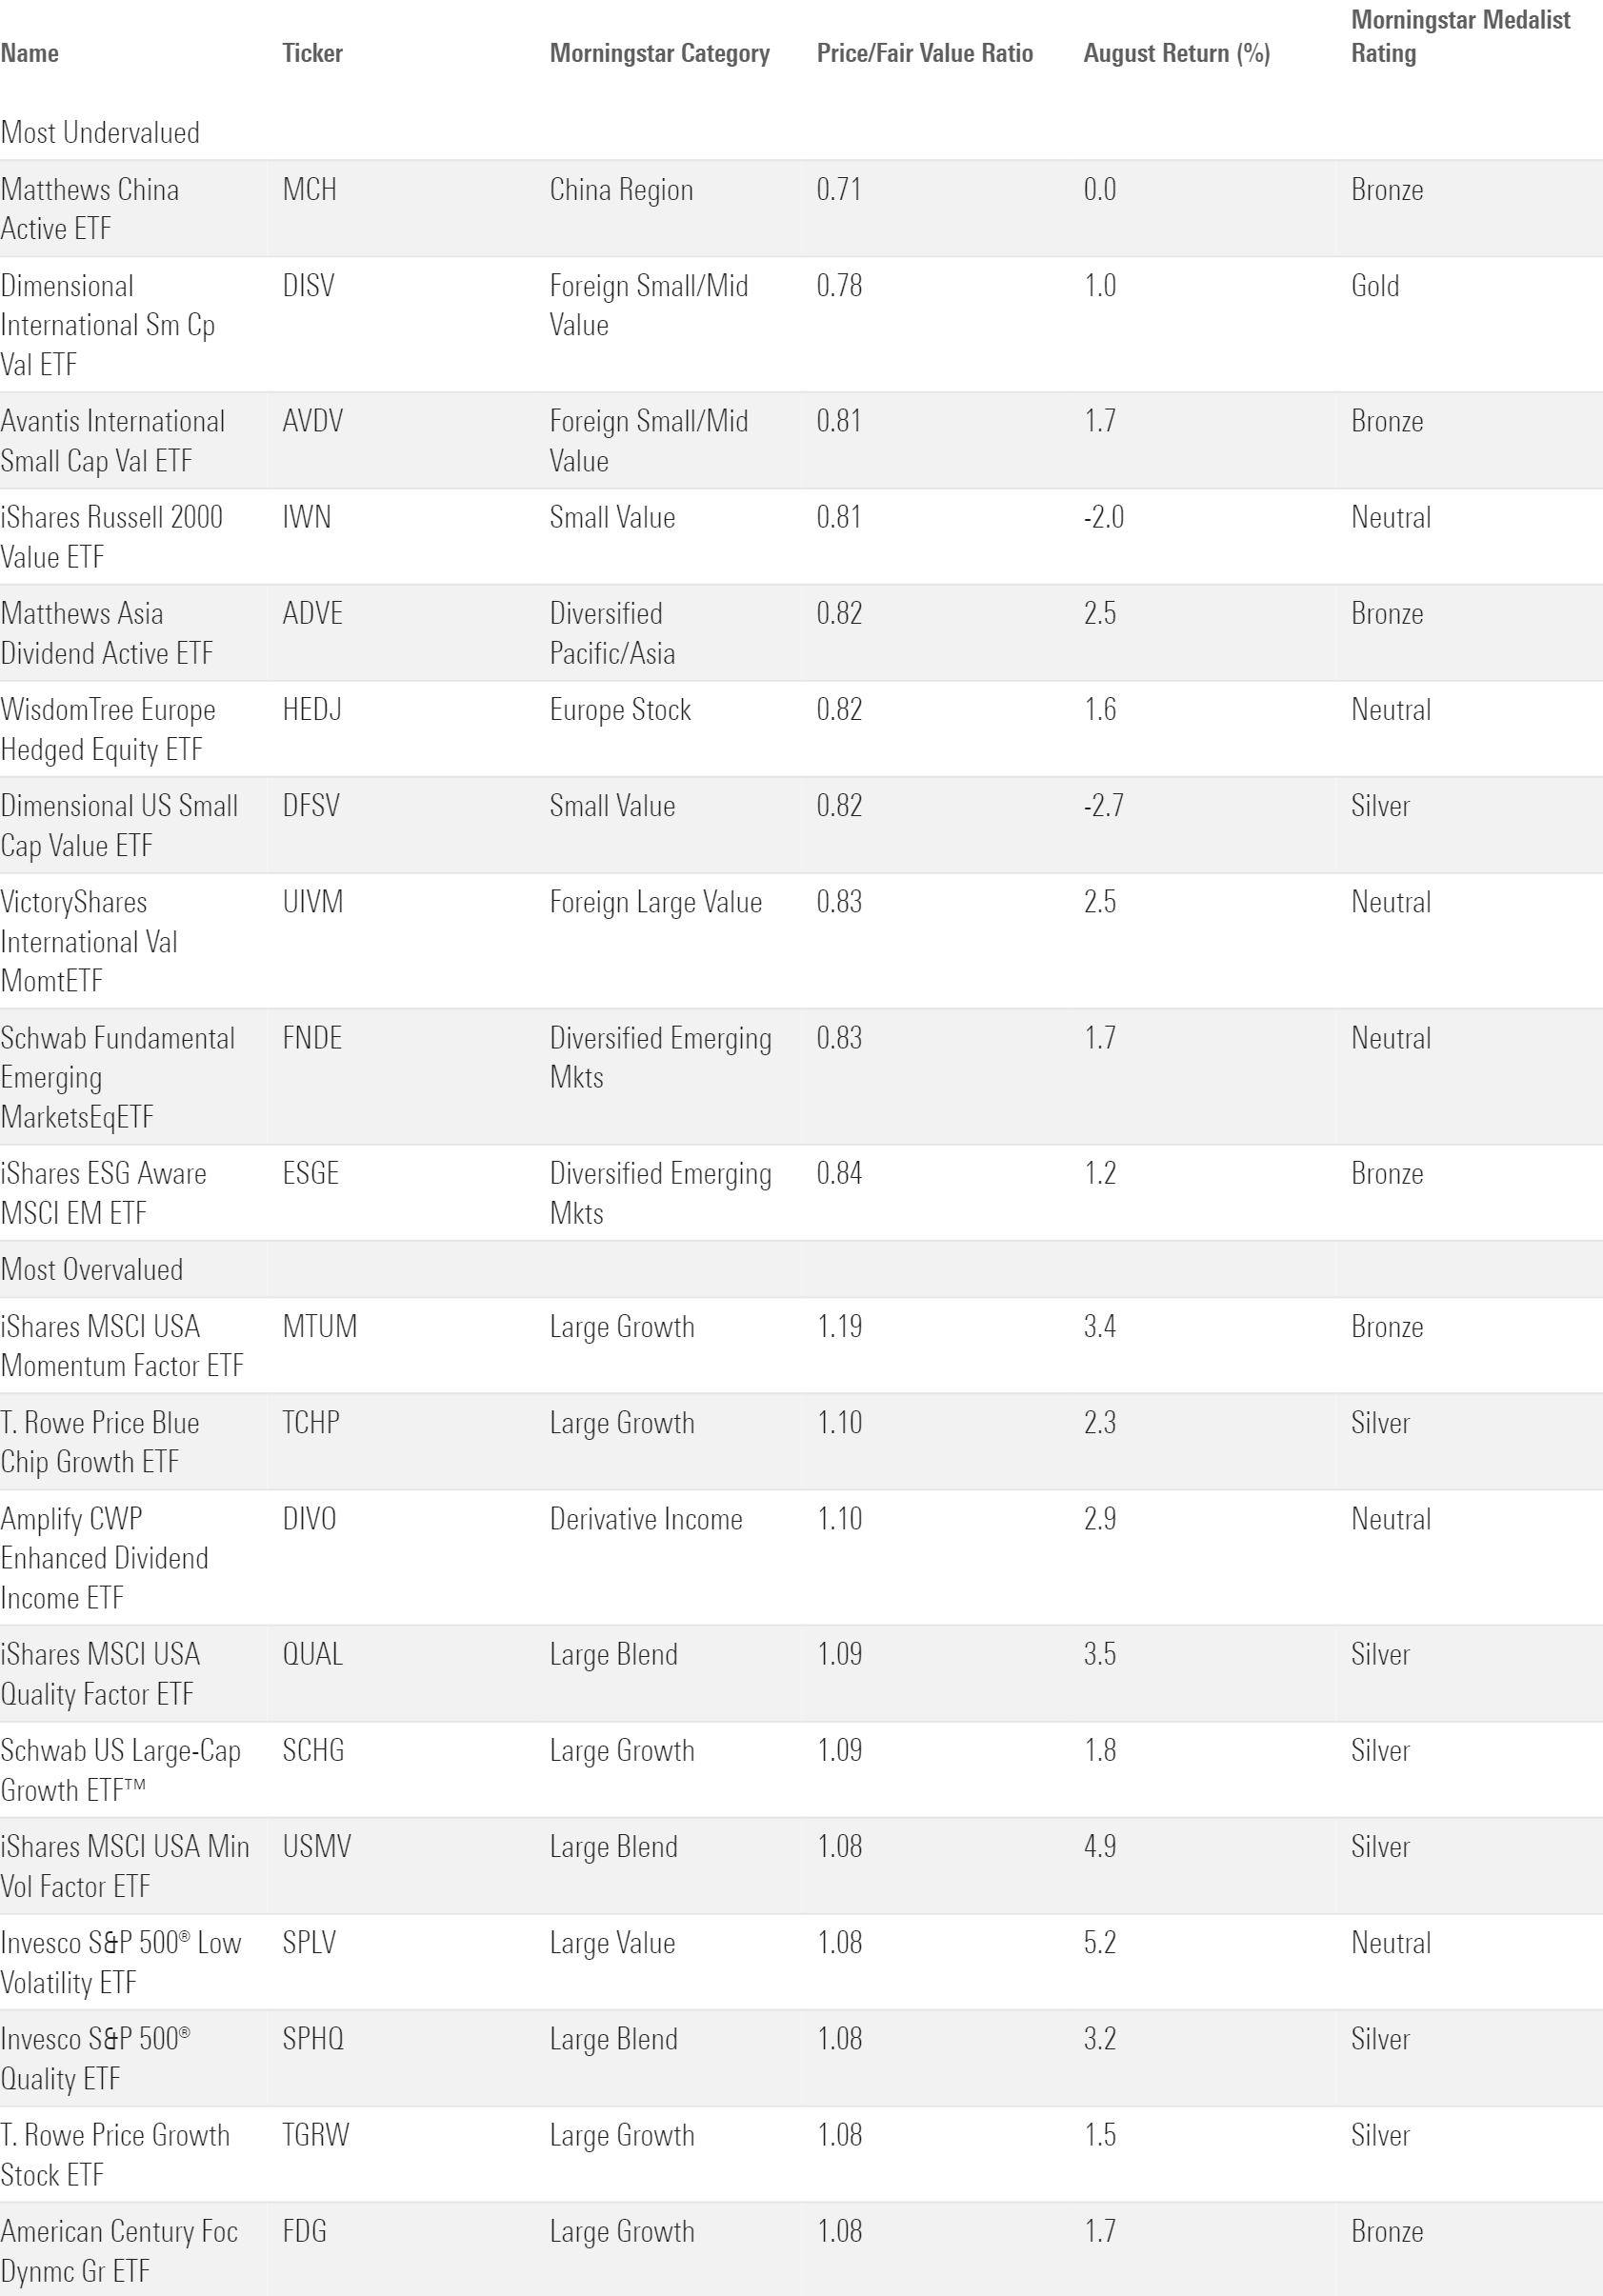
Morningstar’s chief US market strategist David Sekera recently published the US stock market outlook for September 2024, drawing on the same fundamental research that underpins the price/fair value estimate. The article circles the small-value category as the most undervalued corner of the market. Several of the funds on the cheaper half of Exhibit 6 fit that description, whether they invest overseas or stateside.
The author or authors do not own shares in any securities mentioned in this article. Find out about Morningstar’s editorial policies.

/s3.amazonaws.com/arc-authors/morningstar/30e2fda6-bf21-4e54-9e50-831a2bcccd80.jpg)
/cloudfront-us-east-1.images.arcpublishing.com/morningstar/NPR5K52H6ZFOBAXCTPCEOIQTM4.png)
/cloudfront-us-east-1.images.arcpublishing.com/morningstar/OMVK3XQEVFDRHGPHSQPIBDENQE.jpg)
/d10o6nnig0wrdw.cloudfront.net/09-24-2024/t_c34615412a994d3494385dd68d74e4aa_name_file_960x540_1600_v4_.jpg)
:quality(80)/s3.amazonaws.com/arc-authors/morningstar/30e2fda6-bf21-4e54-9e50-831a2bcccd80.jpg)